Improving Patient Flow: Analysis of an Initiative to Improve Early Discharge


BACKGROUND: Discharge delays adversely affect hospital bed availability and thus patient flow.
OBJECTIVE: We aimed to increase the percentage of early discharges (EDCs; before 11 am). We hypothesized that obtaining at least 25% EDCs would decrease emergency department (ED) and postanesthesia care unit (PACU) hospital bed wait times.
DESIGN: This study used a pre/postintervention retrospective analysis.
SETTING: All acute care units in a quaternary care academic children’s hospital were included in this study.
PATIENTS: The patient sample included all discharges from the acute care units and all hospital admissions from the ED and PACU from January 1, 2014, to December 31, 2016.
INTERVENTION: A multidisciplinary team identified EDC barriers, including poor identification of EDC candidates, accountability issues, and lack of team incentives. A total of three successive interventions were implemented using Plan–Do-Check-Act (PDCA) cycles over 10 months between 2015 and 2016 addressing these barriers. Interventions included EDC identification and communication, early rounding on EDCs, and modest incentives.
MEASUREMENTS: Calendar month EDC percentage, ED (from time bed requested to the time patient left ED) and PACU (from time patient ready to leave to time patient left PACU) wait times were measured.
RESULTS: EDCs increased from an average 8.8% before the start of interventions (May 2015) to 15.8% after interventions (February 2016). Using an interrupted time series, both the jump and the slope increase were significant (3.9%, P = .02 and 0.48%, P < .01, respectively). Wait times decreased from a median of 221 to 133 minutes (P < .001) for ED and from 56 to 36 minutes per patient (P = .002) for PACU.
CONCLUSION: A multimodal intervention was associated with more EDCs and decreased PACU and ED bed wait times.
© 2019 Society of Hospital Medicine
There were 16,175 discharges on acute care from January 2014 through December 2016. Across all acute care units, EDCs increased from an average of 8.8% before the start of interventions (May 2015) to 15.8% after all interventions (February 2016). From the estimated trend in the preintervention period, there was a jump of 3.9% to the start of the postintervention trend (P = .02; Figure 2). Furthermore, there was an increase of 0.48% (95% CI 0.15-0.82%; P < .01) per month in the trend of the slope between the pre- and postintervention. The autocorrelation function and the Durbin–Watson test did not show evidence of autocorrelation (P = .85). Lack of evidence for autocorrelation in this and each of our subsequent fitted models led to excluding an autocorrelation parameter from our models.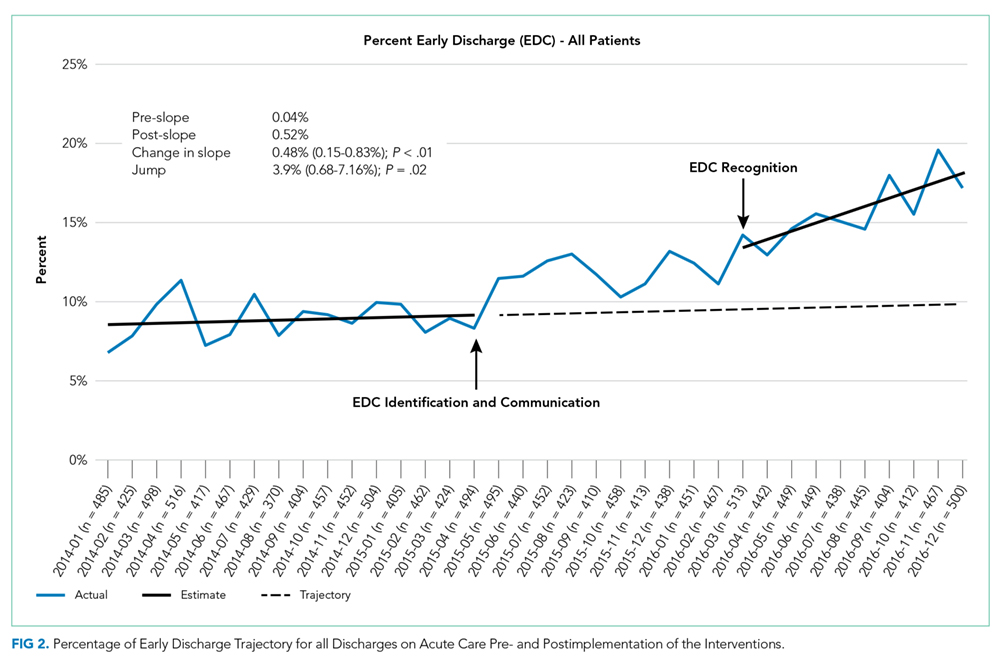
From 16,175 discharges, 1,764 (11%) were assigned to observation status. Among inpatients (14,411), patients with missing values (CMI, insurance status) were also excluded (n = 66, 0.5%). Among the remaining 14,345 inpatients, 54% were males, 50% were government-insured, and 1,645 (11.5%) were discharged early. The average age was 8.5 years, the average LOS was seven days, and the median CMI was 2.2. Children who were younger, had shorter LOS, CMI <2, and nongovernment insurance were more likely to be discharged early (P < .01 for all). For each of these variables, F-tests were performed to determine whether there was a statistically significant reduction in variation by adding the variable to our initial model. None of the variables alone or in combination led to a statistically significant reduction in variation. Including these factors in the interrupted time series did not change the significance of the results (jump at postintervention start 3.6%, 95% CI 0.7%-7.2%; P = .02, slope increased by 0.59% per month, 95% CI 0.29-0.89%; P < .01).
In the subgroup analysis, we did not account for patient factors as they did not change the results in the analysis of total population. Though each group had a greater percentage of EDCs in the postintervention period, the changes in slopes and jumps were primarily nonsignificant (Figure 3). Only the change in slope in group 4 was significant (1.1%, 95% CI 0.3-1.9%; P = .01).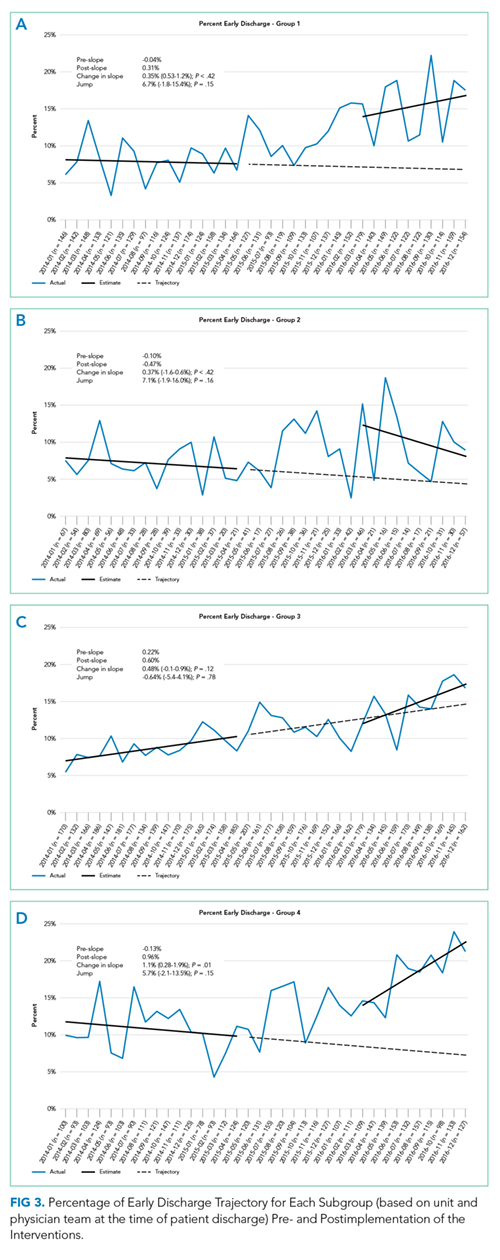
Between January to September 2015 and 2016, ED wait times decreased by 88 minutes (P <.01) and PACU wait times decreased by 20 minutes per patient admitted (P < .01; Table). There was no statistically significant change in seven-day readmissions (P = .19) or in families feeling ready to discharge (P = .11) or in general discharge satisfaction (P = .48) as measured by Press Ganey survey. Among all discharges (inpatient and observation), the average LOS significantly decreased by 0.6 days (P = .02).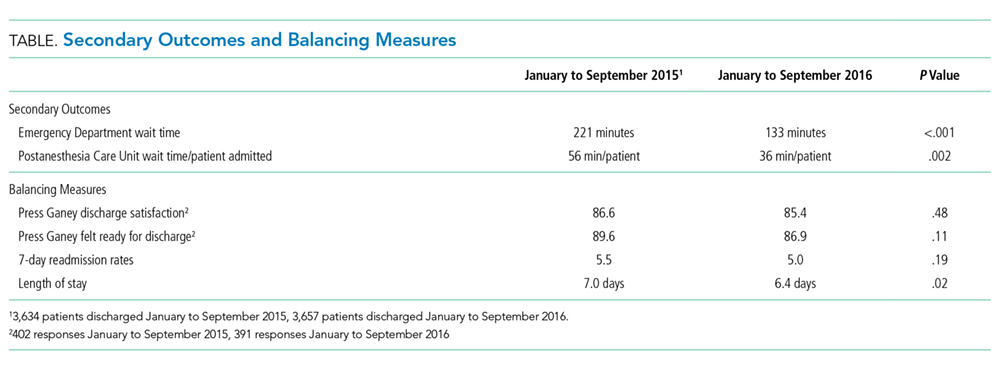
DISCUSSION
The percentage of patients who left the hospital prior to 11