The Virtual Hospitalist: A Single-Site Implementation Bringing Hospitalist Coverage to Critical Access Hospitals


BACKGROUND: On-site hospitalist care can improve patient care, but it is economically infeasible for small critical access hospitals (CAHs). A telemedicine “virtual hospitalist” may expand CAH capabilities at a fractional cost of an on-site provider.
OBJECTIVE: To evaluate the impact of a virtual hospitalist on transfers from a CAH to outside hospitals.
DESIGN, SETTING, AND PARTICIPANTS: A 6-month pilot program providing “virtual hospitalist” coverage to patients at a CAH in rural Iowa.
MEASUREMENTS: The primary outcome was the rate of outside transfers from the CAH Emergency Department (ED). The secondary outcomes included transfer from either the ED or the inpatient wards, daily census, length of stay, transfers after admission, virtual hospitalist time commitment, and patient and staff satisfaction. The preceding 24-week baseline was compared with 24 weeks after implementation, excluding a 2-week transition period.
RESULTS: At baseline, there were 947 ED visits and 176 combined inpatient and observation encounters, compared to 930 and 176 after implementation, respectively. Outside transfers from the ED decreased from 16.6% to 10.5% (157/947 to 98/930, P < .001), and transfers at any time decreased from 17.3% to 11.9% (164/947 to 111/930, P < .001). Daily census, length of stay, and transfers after admission were unchanged. Time commitment for a virtual hospitalist was 35 minutes per patient per day. The intervention was well received by the CAH staff and patients.
CONCLUSIONS: The virtual hospitalist model increased the percentage of ED patients who could safely receive their care locally. A single virtual hospitalist may be able to cover multiple CAHs simultaneously.
© 2018 Society of Hospital Medicine
Statistical Analysis
Baseline data collected over a period of 24 weeks were used to measure pre-implementation performance and trends at VBCH. The virtual hospitalist service was started on November 15, 2016, and the two weeks before and two weeks after this date were excluded from analysis as a transition period. To account for weekend variation, we reported data in consecutive 28-day blocks. We used Chi-square tests to compare proportional outcomes and Student’s t-tests for continuous variables. Statistical Process Control charts were used to evaluate for temporal trends in quantitative data.
Funding
Development of this project was funded through the University of Iowa Hospitalist group and the Signal Center for Health Innovations at UI Health Ventures. Virtual hospitalist clinical time was paid for by the CAH on a fractional basis of a traditional hospitalist based on projected patient volumes through analysis of baseline data. Patients were not directly billed for virtual hospitalist service but were charged for the services provided by CAH providers.
RESULTS
Clinical and Utilization Outcomes
During the 24-week baseline period, VBCH had 947 ED encounters and 176 combined acute inpatient and observation admissions. For the 24 weeks following the transition, there were 930 ED visits and 186 admissions. We observed a 36% (157/947 to 98/930, P < .001) decrease in ED encounters ending in patient transfer to another hospital (Figure). In parallel, VBCH ED visits leading to local admission increased by 62% of baseline (39/947 to 62/930, P = .014). There was no significant change in the fraction of ED encounters resulting in an observation stay (104/947 to 99/930, P = .814). Daily ED visits did not change after virtual hospitalist coverage began (5.64 to 5.54 visits/day, P = .734), but the percentage of ED visits ending in discharge to a nonmedical setting increased from 79.0% to 82.7% (748/947 to 769/930, P = .042).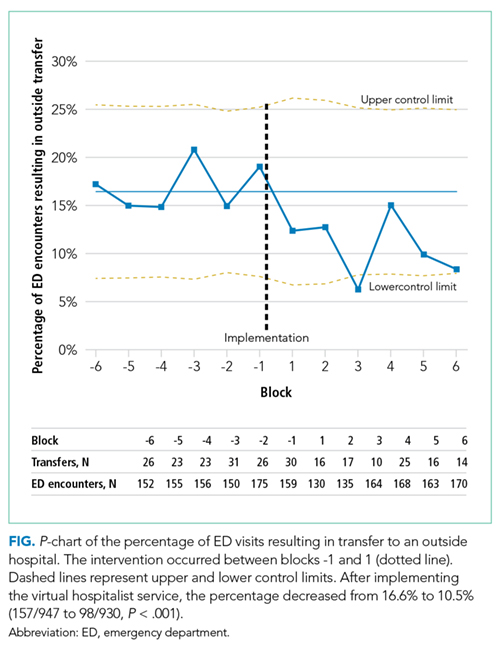
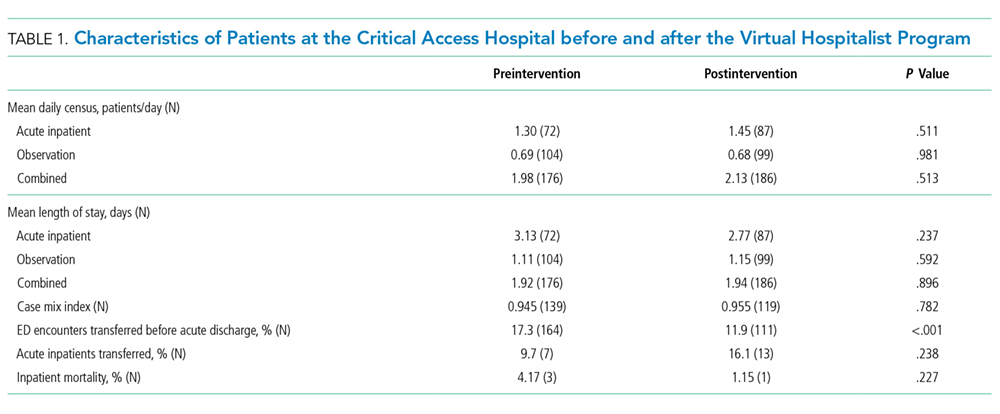
The implementation did not have a significant impact on ward census or patient complexity (Table 1). Both CMI and mean length of stay did not change after starting the service. The study was underpowered to detect differences in rare events, including inpatient mortality and transfer after admission. Despite the decrease in transfers, inpatient census was unchanged. This coincides with a 17% decrease (196/947 to 160/930, P = .054) in the proportion of ED patients referred for admission either locally or at an outside hospital.
Virtual Hospitalist Outcomes
Satisfaction Outcomes
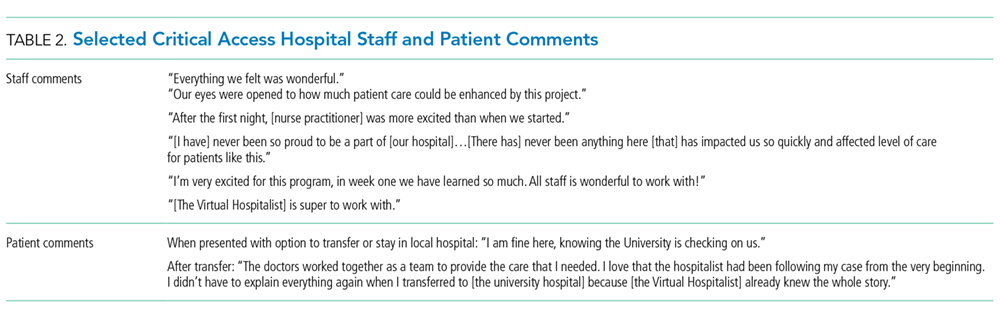
The staff at VBCH identified several benefits to the virtual hospitalist service. Survey responses (N = 18) were positive, with staff expressing specific gratitude for the additional education and training provided by the virtual hospitalists. On a Likert scale ranging from 1 (very poor) to 5 (excellent), the respondents gave high mean scores to the overall service experience (4.8) and the effectiveness of care delivered (4.9) but were more critical of the ability to keep patients locally (4.5) and the experience with transferring patients (3.9). We also collected free-text feedback from both patients and staff at VBCH (Table 2).