The Association of Inpatient Occupancy with Hospital-Acquired Clostridium difficile Infection


Few studies have evaluated the relationship between high hospital occupancy and hospital-acquired complications. We evaluated the association between inpatient occupancy and hospital-acquired Clostridium difficile infection (CDI) using a novel measure of hospital occupancy. We analyzed administrative data from California hospitals from 2008–2012 for Medicare recipients aged ≥65 years with a discharge diagnosis of acute myocardial infarction, heart failure, or pneumonia. Using daily census data, we constructed patient-level measures of occupancy on admission day and average occupancy during hospitalization (range: 0-1), which were split into 4 groups. We used logistic regression with cluster standard errors to estimate the adjusted and unadjusted relationship of occupancy with hospital-acquired CDI. Across 327 hospitals, 558,344 discharges met our inclusion criteria. Higher admission day occupancy was associated with significantly lower adjusted likelihood of CDI. Compared to the 0-0.25 occupancy group, patients admitted on a day of 0.51-0.75 occupancy had 0.86 odds of CDI (95% CI 0.75-0.98). The 0.76-1.00 admission occupancy group had 0.87 odds of CDI (95% CI 0.75-1.01). With regard to average occupancy, intermediate levels of occupancy 0.26-0.50 (odds ratio [OR] = 3.04, 95% CI 2.33-3.96) and 0.51-0.75 (OR = 3.28, 95% CI 2.51-4.28) had over 3-fold increased adjusted odds of CDI relative to the low occupancy group; the high occupancy group did not have significantly different odds of CDI compared to the low occupancy group (OR = 0.96, 95% CI 0.70-1.31). These findings should prompt exploration of how hospitals react to occupancy changes and how those care processes translate into hospital-acquired complications in order to inform best practices.
© 2018 Society of Hospital Medicine
Measure of Occupancy
Calculating Daily Census and Bed Capacity
We calculated the daily census using admission date and HLOS for each observation in our dataset. We approximated the bed capacity as the maximum daily census in the 121-day window (+/- 60 days) around each census day in each hospital. The 121-day window was chosen to increase the likelihood of capturing changes in bed availability (eg, due to unit closures) and seasonal variability. Our daily census does not include patients admitted with psychiatric and obstetrics diagnoses and long-term care/rehabilitation stays (identified through CCS categories and excluded) because these patients are not likely to compete for the same hospital resources as those receiving care for MI, HF, and PNA. See Appendix Table 1 for definition of the occupancy terms.
Calculating Relative Daily Occupancy
We developed a raw hospital-specific occupancy measure by dividing the daily census by the maximum census in each 121-day window for each hospital. We converted these raw measures to percentiles within the 121-day window to create a daily relative occupancy measure. For example, median level occupancy day would correspond to an occupancy of 0.5; a minimum or maximum occupancy day would correspond to 0 or 1, respectively. We preferred a relative occupancy measure because it assumes that what constitutes “high occupancy” likely depends on the usual occupancy level of the facility.
Measuring Admission Day Occupancy and Average Occupancy over Hospitalization
Using the relative daily occupancy values, we constructed patient-level variables representing occupancy on admission day and average occupancy during hospitalization.
Data Analysis
First, we estimated descriptive statistics of the sample for occupancy, patient-level (eg, age, race, gender, and severity of illness), hospital-level (eg, size, teaching status, and urbanicity), and incident-level (day-of-the-week and season) variables. Next, we used logistic regression with cluster standard errors to estimate the adjusted and unadjusted association of occupancy with CDI. For this analysis, occupancy was broken into 4 groups: 0.00-0.25 (low occupancy); 0.26-0.50; 0.51-0.75; and 0.76-1.00 (high occupancy), with the 0.0-0.25 group treated as the reference level. We fit separate models for admission and average occupancy and re-ran the latter model including HLOS as a sensitivity analysis.
RESULTS
Study Population and Hospitals
Across 327 hospitals, 558,829 discharges (including deaths) met our inclusion criteria and there were 2045 admissions with CDI. The hospital and discharge characteristics are reported in Appendix Table 2.
Relationship of Occupancy with CDI
With regard to admission occupancy, the 0.26-0.50 group did not have a significantly higher rate of CDI than the low occupancy group. Both the 0.51-0.75 and the 0.76-1.00 occupancy groups had 15% lower odds of CDI compared to the low occupancy group (Table). The adjusted results were similar, although the comparison between the low and high occupancy groups was marginally nonsignificant.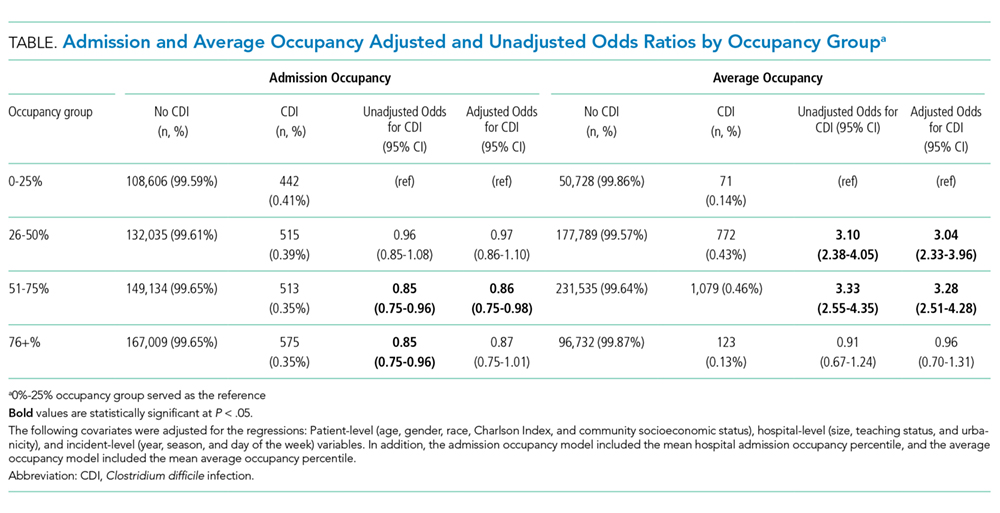
With regard to average occupancy, intermediate levels of occupancy (ie, 0.26-0.50 and 0.51-0.75 groups) had over 3-fold increased odds of CDI relative to the low occupancy group; the high occupancy group did not have significantly different odds of CDI compared to the low occupancy group (Table 1). The adjusted results were similar with no changes in statistical significance. Including HLOS tempered the adjusted odds of CDI to 1.6 for intermediate levels of occupancy, but these remained significantly higher than high or low occupancy.
DISCUSSION
Hospital occupancy is related to CDI. However, contrary to expectation, we found that higher admission and average occupancy over hospitalization were not related to more hospital-acquired CDI. CDI rates were highest for intermediate levels of average occupancy with lower CDI rates at high and low occupancy. CDI had an inverse relationship with admission occupancy.
These findings suggest that an exploration of the processes associated with hospitals accommodating higher occupancy might elucidate measures to reduce CDI. How do staffing, implementation of policies, and routine procedures vary when hospitals are busy or quiet? What aspects of care delivery that function well during high and low occupancy periods breakdown during intermediate occupancy? Hospital policies, practices, and procedures during different phases of occupancy might inform best practices. These data suggest that hospital occupancy level should be a routinely collected data element by infection control officers and that this should be linked with protocols triggered or modified with high or low occupancy that might affect HACs.
Previous studies in Europe found increasing hospital-acquired infection rates with increasing occupancy.13-15 The authors postulated that increasing occupancy may limit available resources and increase nursing workloads, negatively impacting adherence to hand hygiene and cleaning protocols .8 However, these studies did not account for infections that were POA. In addition, our study examined hospitals in California after the 2006 implementation of the minimum nurse staffing policy, which means that staff to patient ratios could not fall below fixed thresholds that were typically higher than pre-policy ratios.19
This study had limitations pertaining to coded administrative data, including quality of coding and data validity. However, OSHPD has strict data reporting processes.20 This study focused on 1 state; however, California is large with a demographically diverse population and hospital types, characteristics that would help generalize findings. Furthermore, when using the average occupancy measure, we could not determine whether the complication was acquired during the high occupancy period of the hospitalization.
Higher admission day occupancy was associated with lower likelihood of CDI, and CDI rates were lower at high and low average occupancy. These findings should prompt exploration of how hospitals react to occupancy changes and how those care processes translate into HACs in order to inform best practices for hospital care.
