Characterizing Hospitalizations for Pediatric Concussion and Trends in Care


BACKGROUND: Children hospitalized for concussion may be at a higher risk for persistent symptoms, but little is known about this subset of children.
OBJECTIVE: Delineate a cohort of children admitted for concussion, describe care practices received, examine factors associated with prolonged length of stay (LOS) or emergency department (ED) readmission, and investigate changes in care over time.
DESIGN/SETTING: Retrospective analysis of data submitted by 40 pediatric hospitals to the Pediatric Health Information System.
PATIENTS: Children 0 to 17 years old admitted with a primary diagnosis of concussion from 2007 to 2014.
MEASUREMENTS: Descriptive statistics characterized this cohort and care practices delivered, logistic regression identified factors associated with a LOS of ≥2 days and ED readmission, and trend analyses assessed changes in care over time.
RESULTS: Of the 10,729 children admitted for concussion, 68.7% received intravenous pain or antiemetic medications. Female sex, adolescent age, and having government insurance were all associated (P ≤ .02) with increased odds of LOS ≥ 2 days and ED revisit. Proportions of children receiving intravenous ondansetron (slope = 1.56, P = .001) and ketorolac (slope = 0.61, P < .001) increased over time, and use of neuroimaging (slope = −1.75, P < .001) decreased.
CONCLUSIONS: Although concussions are usually self-limited, hospitalized children often receive intravenous therapies despite an unclear benefit. Factors associated with prolonged LOS and ED revisit were similar to predictors of postconcussive syndrome. Since there has been an increased use of specific therapeutics, prospective evaluation of their relationship with concussion recovery could lay the groundwork for evidenced-based admission criteria and optimize recovery.
© 2018 Society of Hospital Medicine
Hospital Characteristics
Hospitals were characterized by region (Northeast, Central, South, and West) and size (small <200, medium 200–400, and large >400 beds). The trauma-level accreditation was identified with Level 1 reflecting the highest possible trauma resources.
Medical Care Variables
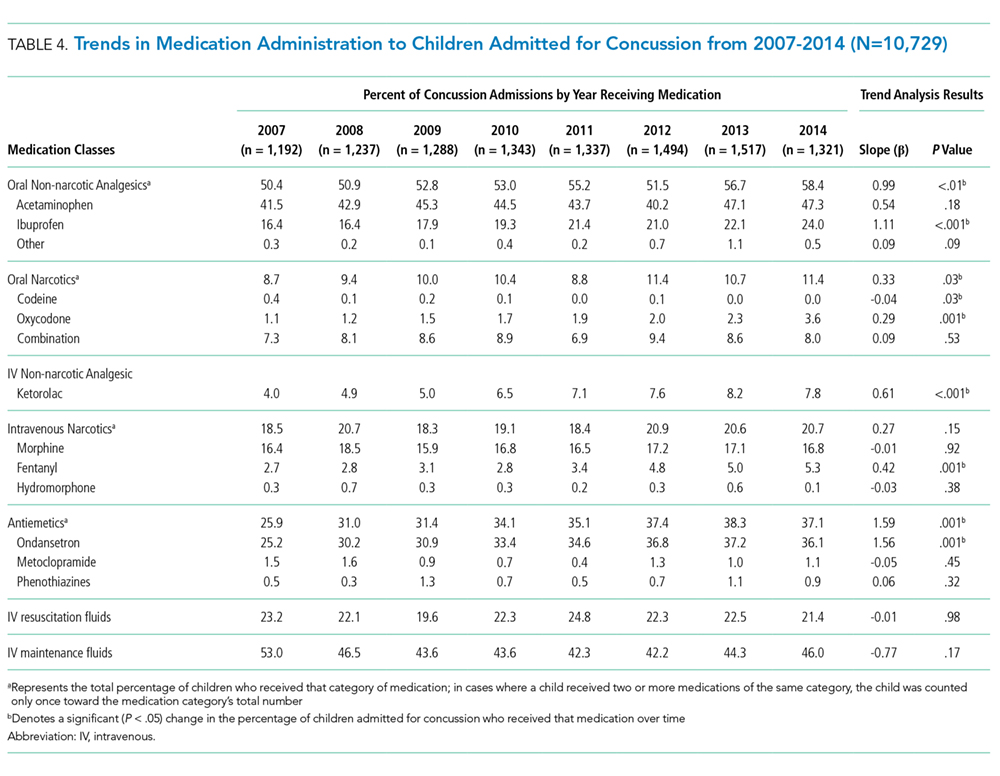
Care variables included medications, neuroimaging, and cost of stay. Medication classes included oral non-narcotic analgesics [acetaminophen, ibuprofen, and others (aspirin, tramadol, and naproxen)], oral narcotics (codeine, oxycodone, and narcotic–non-narcotic combinations), intravenous (IV) non-narcotics (ketorolac), IV narcotics (morphine, fentanyl, and hydromorphone), antiemetics [ondansetron, metoclopramide, and phenothiazines (prochlorperazine, chlorpromazine, and promethazine)], maintenance IV fluids (dextrose with electrolytes or 0.45% sodium chloride), and resuscitation IV fluids (0.9% sodium chloride or lactated Ringer’s solution). Receipt of neuroimaging was determined if head computed tomography (CT) had been conducted at the admitting hospital. Adjusted cost of stay was calculated using a hospital-specific cost-to-charge ratio with additional adjustments using the Center for Medicare & Medicaid’s Wage Index.
Statistical Analyses
Descriptive statistics were calculated for individual, injury, and hospital, and care data elements, LOS, and ED readmissions. The number of children admitted with TBI was used as the denominator to assess the proportion of pediatric TBI admissions that were due to concussions. To identify factors associated with prolonged LOS (ie, ≥2 days) and ED readmission, we employed a mixed models approach that accounted for clustering of observations within hospitals. Independent variables included age, sex, race, ethnicity, payer type, household income, RUCA code, chronic medical condition, and injury mechanism. Models were adjusted for hospital location, size, and trauma-level accreditation. The binary distribution was specified along with a logit link function. A 2-phase process determined factors associated with each outcome. First, bivariable models were developed, followed by multivariable models that included independent variables with P values < .25 in the bivariable analysis. Backward step-wise elimination was performed, deleting variables with the highest P value one at a time. After each deletion, the percentage change in odds ratios was examined; if variable removal resulted in >10% change, the variable was retained as a potential confounder. This process was repeated until all remaining variables were significant (P < .05) with the exception of potential confounders. Finally, we examined the proportion of children receiving selected care practices annually. Descriptive and trend analyses were used to analyze adjusted median cost of stay. Analyses were performed using SAS software (Version 9.3, SAS Institute Inc., Cary, North Carolina).
RESULTS
Over 8 years, 88,526 children were admitted to 40 PHIS hospitals with a TBI-related diagnosis, among whom 13,708 had a primary diagnosis of concussion. We excluded 2,973 children with 1 or more of the following characteristics: a secondary diagnosis of intracranial injury (n = 58), head AIS score > 2 (n = 218), LOS > 7 days (n = 50), OR charges (n = 132), ICU charges (n = 1947), and ISS > 6 (n = 568). Six additional children aging 0 to 4 years were excluded due to child abuse. The remaining 10,729 children, averaging 1300 hospitalizations annually, were identified as being hospitalized primarily for concussion.
Table 1 summarizes the individual characteristics for this cohort. The average (standard deviation) age was 9.5 (5.1) years. Ethnicity was missing for 25.3% and therefore excluded from the multivariable models. Almost all children had a head AIS score of 2 (99.2%), and the majority had a total ISS ≤ 4 (73.4%). The majority of admissions were admitted to Level 1 trauma-accredited hospitals (78.7%) and medium-sized hospitals (63.9%).
The most commonly delivered medication classes were non-narcotic oral analgesics (53.7%), dextrose-containing IV fluids (45.0%), and antiemetic medications (34.1%). IV and oral narcotic use occurred in 19.7% and 10.2% of the children, respectively. Among our cohort, 16.7% received none of these medication classes. Of the 8,940 receiving medication, 32.6% received a single medication class, 29.5% received 2 classes, 20.5% 3 classes, 11.9% 4 classes, and 5.5% received 5 or more medication classes. Approximately 15% (n = 1597) received only oral medications, among whom 91.2% (n = 1457) received only non-narcotic analgesics and 3.9% (n = 63) received only oral narcotic analgesics. The majority (69.5%) received a head CT.
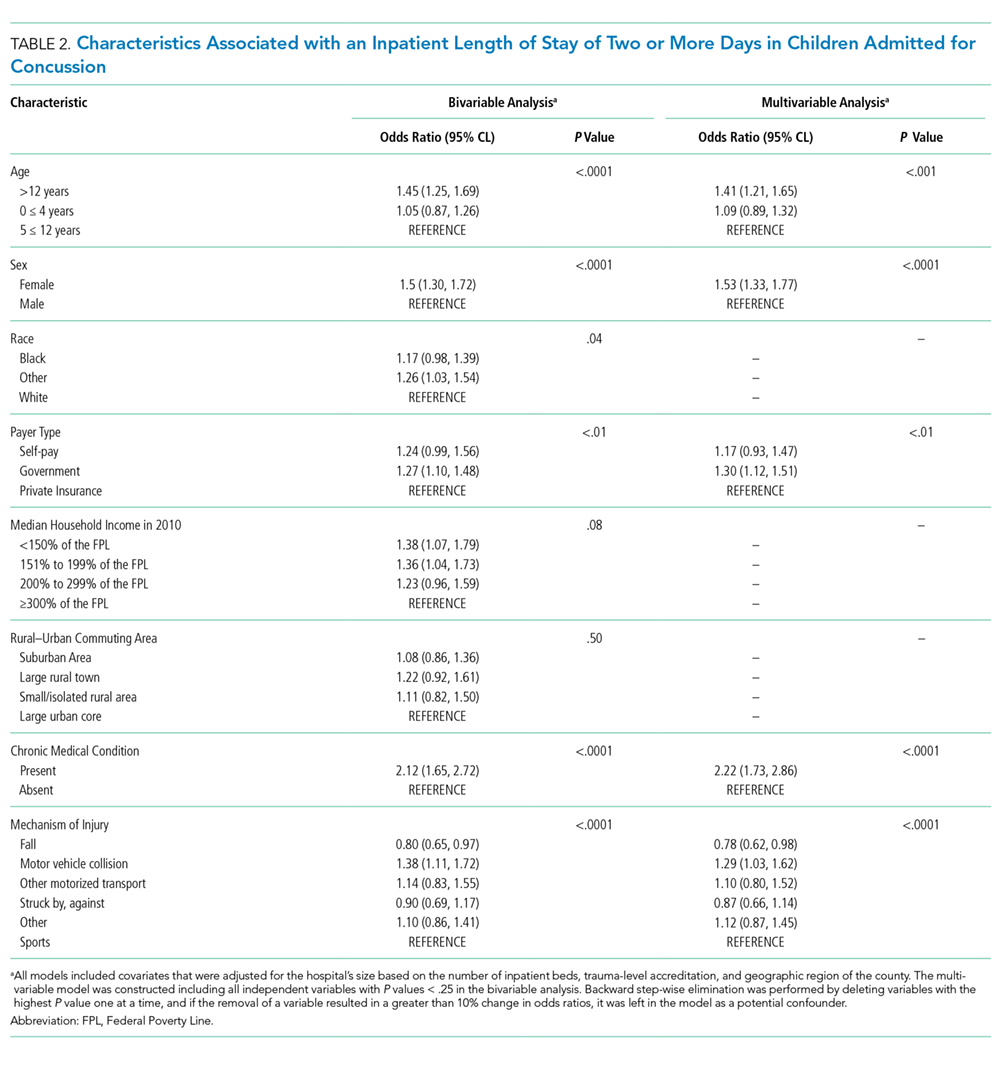
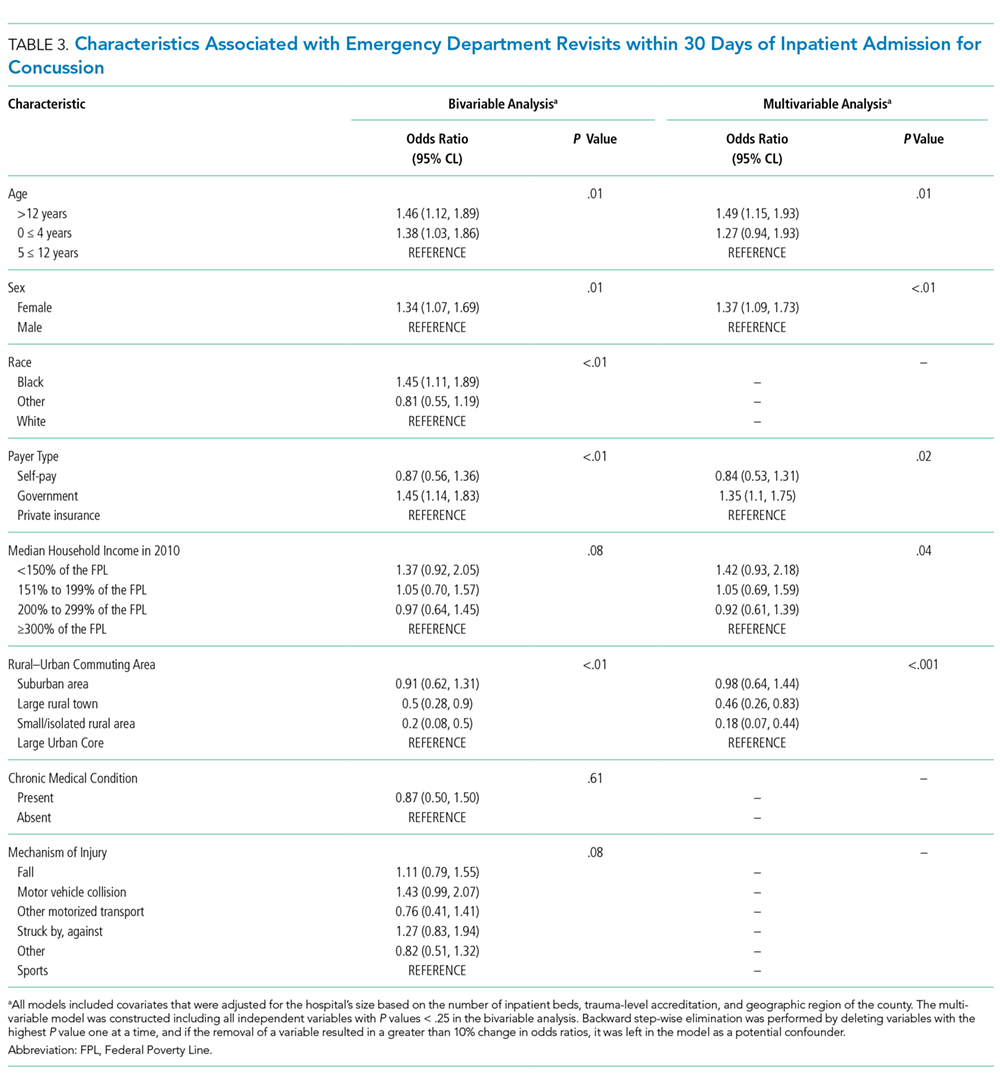
Table 4 summarizes medication administration trends over time. Oral non-narcotic administration increased significantly (slope = 0.99, P < .01) with the most pronounced change occurring in ibuprofen use (slope = 1.11, P < .001). Use of the IV non-narcotic ketorolac (slope = 0.61, P < .001) also increased significantly, as did the proportion of children receiving antiemetics (slope = 1.59, P = .001), with a substantial increase in ondansetron use (slope = 1.56, P = .001). The proportion of children receiving head CTs decreased linearly over time (slope= −1.75, P < .001), from 76.1% in 2007 to 63.7% in 2014. Median cost, adjusted for inflation, increased during our study period (P < .001) by approximately $353 each year, reaching $11,249 by 2014.