The Influence of Hospitalist Continuity on the Likelihood of Patient Discharge in General Medicine Patients


Hospitalists responsible for specific inpatients may change during their hospitalization. To measure the association of hospitalist continuity with the adjusted daily discharge probability, 6,405 admissions (38,967 patient-days, 5,208 patients) to a general medicine service at a tertiary care teaching hospital in 2015 were investigated. Continuity was measured as the consecutive number of days–including weekends–a hospitalist treated a particular team of patients. After accounting for important covariables, discharge probability increased significantly with hospitalist continuity; the adjusted daily discharge probabilities for an average patient with a new physician vs. one on service for 4 continuous weeks were 18.1% and 25.7%, respectively (P < .001). Hospitalist continuity did not influence hospital mortality. Increasing hospitalist continuity could decrease hospital length of stay.
© 2018 Society of Hospital Medicine
Analysis
Logistic generalized estimating equation (GEE) methods were used to model the adjusted daily discharge probability.8 Data in the analytical dataset were expressed in a patient-day format (each dataset row represented one day for a particular patient). This permitted the inclusion of time-dependent covariates and allowed the GEE model to cluster hospitalization days within patients.
Model construction started with the TEND daily discharge probability and the HOMR-now! expected annual death risk (both expressed as log-odds). Then, hospitalist continuity was entered as a time-dependent covariate (ie, its value changed every day). Linear, square root, and natural logarithm forms of physician continuity were examined to determine the best fit (determined using the QIC statistic9). Finally, individual components of the TEND model were also offered to the model with those which significantly improving fit kept in the model. The GEE model used an independent correlation structure since this minimized the QIC statistic in the base model. All covariates in the final daily discharge probability model were used in the hospital death model. Analyses were conducted using SAS 9.4 (Cary, NC).
RESULTS
There were 6,405 general medicine admissions involving 5208 patients and 38,967 patient-days between January 1 and December 31, 2015 (Appendix A). Patients were elderly and were evenly divided in terms of gender, with 85% of them being admitted from the community. Comorbidities were common (median coded Charlson score was 2), with 6.0% of patients known to our cancer clinic. The median length of stay was 4 days (IQR, 2–7), with 378 admissions (5.9%) ending in death and 121 admissions (1.9%) ending in a transfer to another service.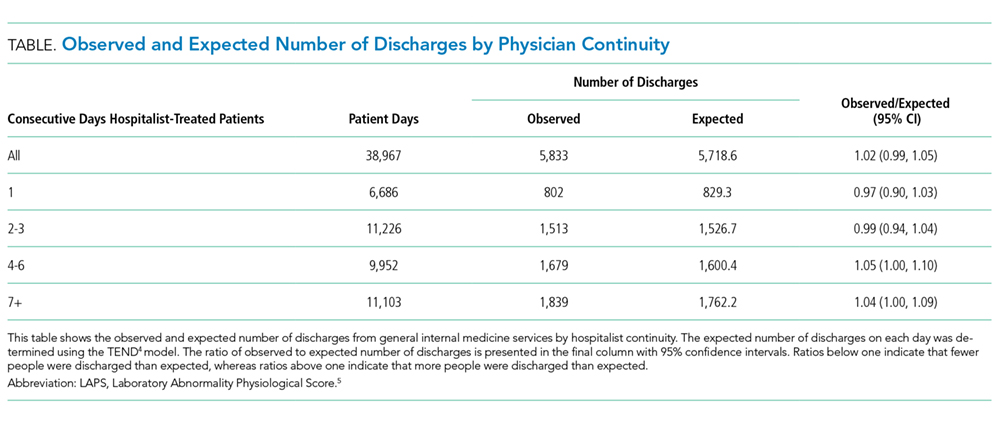
There were 41 different staff people having at least 1 day on service. The median total service by physicians was 9 weeks (IQR 1.8–10.9 weeks). Changes in hospitalist coverage were common; hospitalizations had a median of 1 (IQR 1–2) physician switches and a median of 1 (IQR 1–2) different physicians. However, patients spent a median of 100% (IQR 66.7%–100%] of their total hospitalization with their primary hospitalist. The median duration of individual physician “stints” on service was 5 days (IQR 2–7, range 1–42).
The TEND model accurately estimated daily discharge probability for the entire cohort with 5833 and 5718.6 observed and expected discharges, respectively, during 38,967 patient-days (O/E 1.02, 95% CI 0.99–1.05). Discharge probability increased as hospitalist continuity increased, but this was statistically significant only when hospitalist continuity exceeded 4 days. Other covariables also significantly influenced discharge probability (Appendix B).
After adjusting for important covariables (Appendix C), hospitalist continuity was significantly associated with daily discharge probability (Figure). Discharge probability increased linearly with increasing consecutive days that hospitalists treated patients. For each additional consecutive day with the same hospitalist, the adjusted daily odds increased by 2% (Adj-odds ratio [OR] 1.02, 95% CI 1.01–1.02, Appendix C). When the consecutive number of days that hospitalists remained on service increased from 1 to 28 days, the adjusted discharge probability for the average patient increased from 18.1% to 25.7%, respectively. Discharge was significantly influenced by other factors (Appendix C). Continuity did not influence the risk of death in hospital (Appendix D).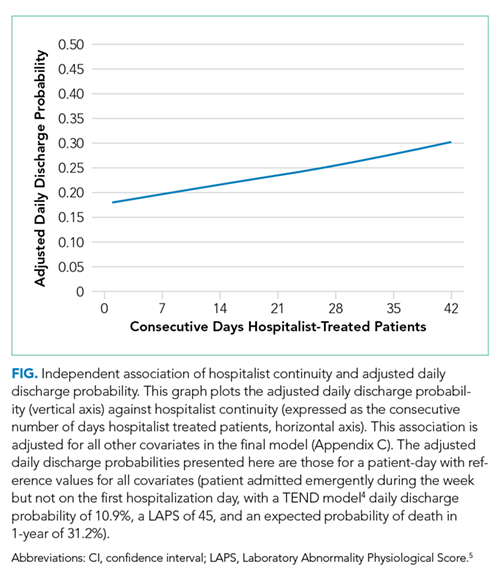
DISCUSSION
In a general medicine service at a large teaching hospital, this study found that greater hospitalist continuity was associated with a significantly increased adjusted daily discharge probability, increasing (in the average patient) from 18.1% to 25.7% when the consecutive number of hospitalist days on service increased from 1 to 28 days, respectively.
The study demonstrated some interesting findings. First, it shows that shifting patient care between physicians can significantly influence patient outcomes. This could be a function of incomplete transfer of knowledge between physicians, a phenomenon that should be expected given the extensive amount of information–both explicit and implicit–that physicians collect about particular patients during their hospitalization. Second, continuity of care could increase a physician’s and a patient’s confidence in clinical decision-making. Perhaps physicians are subconsciously more trusting of their instincts (and the decisions based on those instincts) when they have been on service for a while. It is also possible that patients more readily trust recommendations of a physician they have had throughout their stay. Finally, people wishing to decrease patient length of stay might consider minimizing the extent that hospitalists sign over patient care to colleagues.
Several issues should be noted when interpreting the results of the study. First, the study examined only patient discharge and death. These are by no means the only or the most important outcomes that might be influenced by hospitalist continuity. Second, this study was limited to a single service at a single center. Third, the analysis did not account for house-staff continuity. Since hospitalist and house-staff at the study hospital invariably switched at different times, it is unlikely that hospitalist continuity was a surrogate for house-staff continuity.
