Effect of Hospital Readmission Reduction on Patients at Low, Medium, and High Risk of Readmission in the Medicare Population


BACKGROUND: Hospitalization and readmission rates have decreased in recent years, with the possible consequence that hospitals are increasingly filled with high-risk patients.
OBJECTIVE: We studied whether readmission reduction has affected the risk profile of hospitalized patients and whether readmission reduction was similarly realized among hospitalizations with low, medium, and high risk of readmissions.
DESIGN: Retrospective study of hospitalizations between January 2009 and June 2015.
PATIENTS: Hospitalized fee-for-service Medicare beneficiaries, categorized into 1 of 5 specialty cohorts used for the publicly reported hospital-wide readmission measure.
MEASUREMENTS: Each hospitalization was assigned a predicted risk of 30-day, unplanned readmission using a risk-adjusted model similar to publicly reported measures. Trends in monthly mean predicted risk for each cohort and trends in monthly observed to expected readmission for hospitalizations in the lowest 20%, middle 60%, and highest 20% of risk of readmission were assessed using time series models.
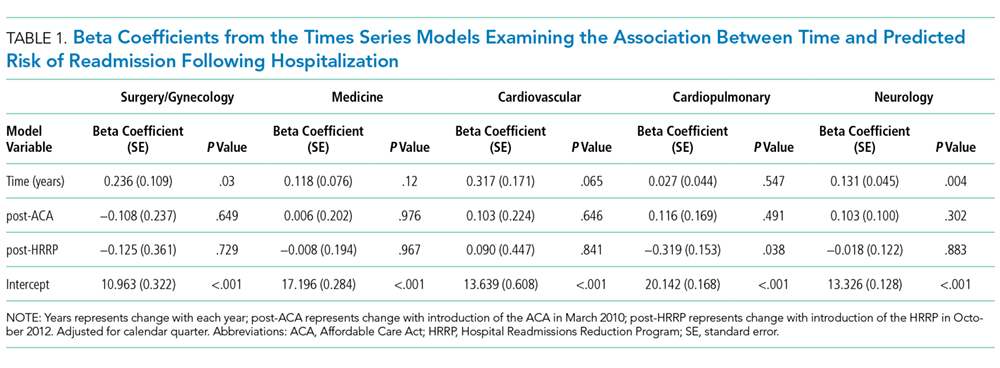
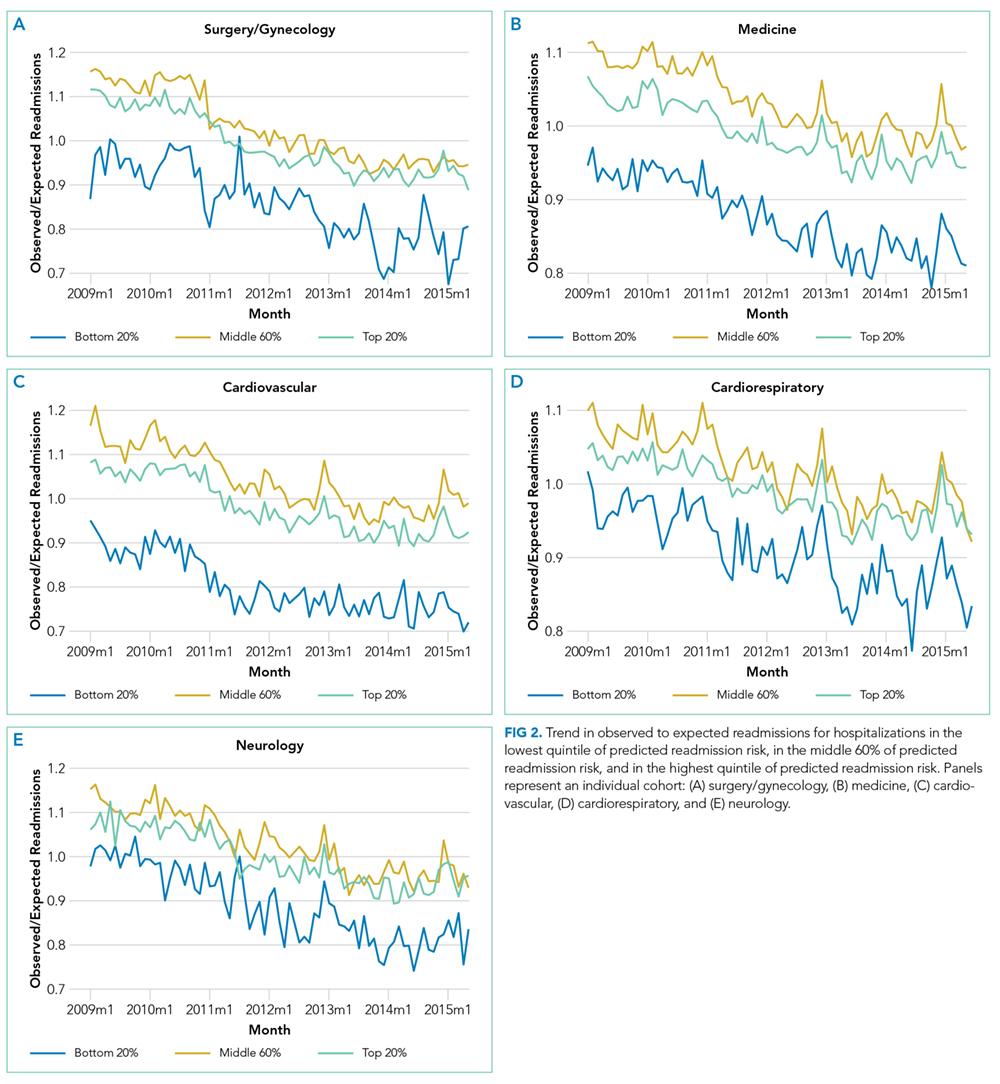
RESULTS: Of 47,288,961 hospitalizations, 16.2% (n = 7,642,161) were followed by an unplanned readmission within 30 days. We found that predicted risk of readmission increased by 0.24% (P = .03) and 0.13% (P = .004) per year for hospitalizations in the surgery/gynecology and neurology cohorts, respectively. We found no significant increase in predicted risk for hospitalizations in the medicine (0.12%, P = .12), cardiovascular (0.32%, P = .07), or cardiorespiratory (0.03%, P = .55) cohorts. In each cohort, observed to expected readmission rates steadily declined, and at similar rates for patients at low, medium, and high risk of readmission.
CONCLUSIONS: Hospitals have been effective at reducing readmissions across a range of patient risk strata and clinical conditions. The risk of readmission for hospitalized patients has increased for 2 of 5 clinical cohorts.
© 2018 Society of Hospital Medicine
Statistical Analysis
We developed generalized estimating equation models to predict 30-day unplanned readmission for each of the 5 specialty cohorts. The 5 models were fit using all patients in each cohort for the included time period and were adjusted for clustering by hospital. We assessed discrimination by calculating area under the receiver operating characteristic curve (AUC) for the 5 models; the AUCs measured the models’ ability to distinguish patients who were readmitted versus those who were not.18 We also calculated AUCs for each year to examine model performance over time.
Using these models, we calculated predicted risk for each hospitalization and averaged these to obtain mean predicted risk for each specialty cohort for each month. To test for trends in mean risk, we estimated 5 time series models, one for each cohort, with the dependent variable of monthly mean predicted risk. For each cohort, we first estimated a series of 12 empty autoregressive models, each with a different autoregressive term (1, 2...12). For each model, we calculated χ2 for the test that the autocorrelation was 0; based on a comparison of chi-squared values, we specified an autocorrelation of 1 month for all models. Accordingly, a 1-month lag was used to estimate one final model for each cohort. Independent variables included year and indicators for post-ACA and post-HRRP; these variables captured the effect of trends over time and the introduction of these policy changes, respectively.19
To determine whether changes in risk over time were a result of changes in particular risk groups, we categorized hospitalizations into risk strata based on quintiles of predicted risk for each specialty cohort for the entire study period. For each individual year, we calculated the proportion of hospitalizations in the highest, middle, and lowest readmission risk strata for each cohort.
We calculated the monthly ratio of O/E readmission for hospitalizations in the lowest 20%, middle 60%, and highest 20% of readmission risk by month; O/E reflects the excess or deficit observed events relative to the number predicted by the model. Using this monthly O/E as the dependent variable, we developed autoregressive time series models as above, again with a 1-month lag, for each of these 3 risk strata in each cohort. As before, independent variables were year as a continuous variable, indicator variables for post-ACA and post-HRRP, and a categorical variable for calendar quarter.
All analyses were done in SAS version 9.3 (SAS Institute Inc., Cary, NC) and Stata version 14.2 (StataCorp LLC, College Station, TX).
RESULTS
We included 47,288,961 hospitalizations in the study, of which 11,231,242 (23.8%) were in the surgery/gynecology cohort, 19,548,711 (41.3%) were in the medicine cohort, 5,433,125 (11.5%) were in the cardiovascular cohort, 8,179,691 (17.3%) were in the cardiorespiratory cohort, and 2,896,192 (6.1%) were in the neurology cohort. The readmission rate was 16.2% (n = 7,642,161) overall, with the highest rates observed in the cardiorespiratory (20.5%) and medicine (17.6%) cohorts and the lowest rates observed in the surgery/gynecology (11.8%) and neurology (13.8%) cohorts.
The final predictive models for each cohort ranged in number of parameters from 56 for the cardiorespiratory cohort to 264 for the surgery/gynecology cohort. The models had AUCs of 0.70, 0.65, 0.67, 0.65, and 0.63 for the surgery/gynecology, medicine, cardiovascular, cardiorespiratory, and neurology cohorts, respectively; AUCs remained fairly stable over time for all disease cohorts (Appendix Table 1).