Do Bedside Visual Tools Improve Patient and Caregiver Satisfaction? A Systematic Review of the Literature


BACKGROUND: Although common, the impact of low-cost bedside visual tools, such as whiteboards, on patient care is unclear.
PURPOSE: To systematically review the literature and assess the influence of bedside visual tools on patient satisfaction.
DATA SOURCES: Medline, Embase, SCOPUS, Web of Science, CINAHL, and CENTRAL.
DATA EXTRACTION: Studies of adult or pediatric hospitalized patients reporting physician identification, understanding of provider roles, patient–provider communication, and satisfaction with care from the use of visual tools were included. Outcomes were categorized as positive, negative, or neutral based on survey responses for identification, communication, and satisfaction. Two reviewers screened studies, extracted data, and assessed the risk of study bias.
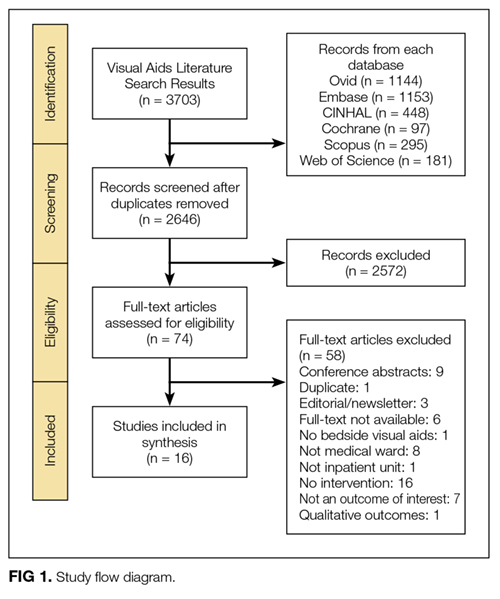
DATA SYNTHESIS: Sixteen studies met the inclusion criteria. Visual tools included whiteboards (n = 4), physician pictures (n = 7), whiteboard and picture (n = 1), electronic medical record-based patient portals (n = 3), and formatted notepads (n = 1). Tools improved patients’ identification of providers (13/13 studies). The impact on understanding the providers’ roles was largely positive (8/10 studies). Visual tools improved patient–provider communication (4/5 studies) and satisfaction (6/8 studies). In adults, satisfaction varied between positive with the use of whiteboards (2/5 studies) and neutral with pictures (1/5 studies). Satisfaction related to pictures in pediatric patients was either positive (1/3 studies) or neutral (1/3 studies). Differences in tool format (individual pictures vs handouts with pictures of all providers) and study design (randomized vs cohort) may explain variable outcomes.
CONCLUSION: The use of bedside visual tools appears to improve patient recognition of providers and patient–provider communication. Future studies that include better design and outcome assessment are necessary before widespread use can be recommended.
© 2017 Society of Hospital Medicine
Quality Assessment
As recommended by the Cochrane Collaboration, 2 reviewers (AG, KT) assessed the risk of study bias by using the Downs and Black Scale.17,19 Discrepancies in assessment were resolved by a third reviewer (VC). This instrument uses a point-based system to estimate the quality of a study by rating domains such as internal and external validity, bias, and confounding. In keeping with prior systematic reviews,18,20,21 studies with a score of ≥18 were considered high quality. Interrater agreement for the adjudication of study quality was calculated using the Cohen κ statistic.
RESULTS


STUDIES OF ADULT HOSPITALIZED PATIENTS
Eleven studies were conducted on adult hospitalized patients 12-14,22-24,26,27,29,30,33 and included 3 randomized controlled studies.14,27,33
Results by Outcomes Provider Identification Nine studies measured patients’ ability to identify providers with the use of visual aids, and all 9 reported improvements in this outcome. Visual tools used to measure provider identification included pictures (n = 5),13,14,23,27,33 whiteboards (n = 3),12,22,30 and patient portals (n = 1).26 Within studies that used pictures, individual pictures (n = 2)13,23 and handouts with pictures of multiple providers (n = 3) were used.14,27,33 In 2 studies, care team members such as a dietitian, physiotherapist or pharmacist, were included when measuring identification.14,33
Understanding Providers’ RolesSix studies assessed the effect of visual tools on patients’ understanding of provider roles.13,14,22,26,27,33 Four studies reported a positive effect with the use of pictures,27,33 whiteboards,22 and patient portals.26 However, 2 studies reported either no difference or negative impressions. Appel et al.14 reported no difference in the understanding of physician roles using a handout of providers’ pictures and titles. Arora et al.13 used individual pictures of physicians with descriptions of roles and found a negative association, as demonstrated by fewer patients rating their understanding of physicians’ roles as excellent or very good in the intervention period (45.6%) compared with the baseline (55.3%).
Patient–Provider Communication
Three studies evaluated the influence of visual tools on communication.14,24,29 Using pictures, Appel et al.14 found no difference in the perceived quality of communication. Singh et al.29 used whiteboards and reported improved communication scores for physicians and nurses. With notepads, patients surveyed by Farberg et al.24 stated that the tool improved provider communication.
Patient Satisfaction
Five studies assessed patient satisfaction related to the use of visual tools. 22,23,27,30,33 One study reported satisfaction as positive with the use of individual pictures.23 Two studies that used handouts with pictures of all team members reported either a positive33 or neutral27 impact on satisfaction. Studies that used whiteboards reported a positive association with satisfaction22,30 despite differences in content, such as the inclusion of prewritten prompts for writing goals of care and scheduled tests30 versus the name of the nurse and their education level.22
