Sound and Light Levels Are Similarly Disruptive in ICU and non-ICU Wards


BACKGROUND: Hospitalized patients frequently report poor sleep, partly due to the inpatient environment. In-hospital sound and light levels are not well described on non-intensive care unit (non-ICU) wards. Although non-ICU wards may have lower average and peak noise levels, sound level changes (SLCs), which are important in disrupting sleep, may still be a substantial problem.
OBJECTIVE: To compare ambient sound and light levels, including SLCs, in ICU and non-ICU environments.
DESIGN: Observational study.
SETTING: Tertiary-care hospital.
MEASUREMENTS: Sound measurements of 0.5 Hz were analyzed to provide average hourly sound levels, sound peaks, and SLCs ≥17.5 decibels (dB). For light data, measurements taken at 2-minute intervals provided average and maximum light levels.
RESULTS: The ICU rooms were louder than non-ICU wards; hourly averages ranged from 56.1 ± 1.3 dB to 60.3 ± 1.7 dB in the ICU, 47.3 ± 3.7 dB to 55.1 ± 3.7 dB on the telemetry floor, and 44.6 ± 2.1 dB to 53.7 ± 3.6 dB on the general ward. However, SLCs ≥ 17.5 dB were not statistically different (ICU, 203.9 ± 28.8 times; non-ICU, 270.9 ± 39.5; P = 0.11). In both ICU and non-ICU wards, average daytime light levels were <250 lux, and peak light levels occurred in the afternoon and early evening.
CONCLUSIONS: Quieter, non-ICU wards have as many SLCs as ICUs do, which has implications for quality improvement measurements. Efforts to further reduce average noise levels might be counterproductive. Light levels in the hospital (ICU and non-ICU) may not be optimal for maintenance of a normal circadian rhythm for most people.
© 2017 Society of Hospital Medicine
Sound Measurements
Sound meters measured ambient noise in dB every 2 seconds and were set for A-weighted frequency measurements. We averaged individual data points to obtain hourly averages for ICU and non-ICU rooms. For hourly sound averages, we further separated the data to compare the general ward telemetry floors (both non-ICU), the latter of which has more patient monitoring and a lower nurse-to-patient ratio compared with the general ward floor.
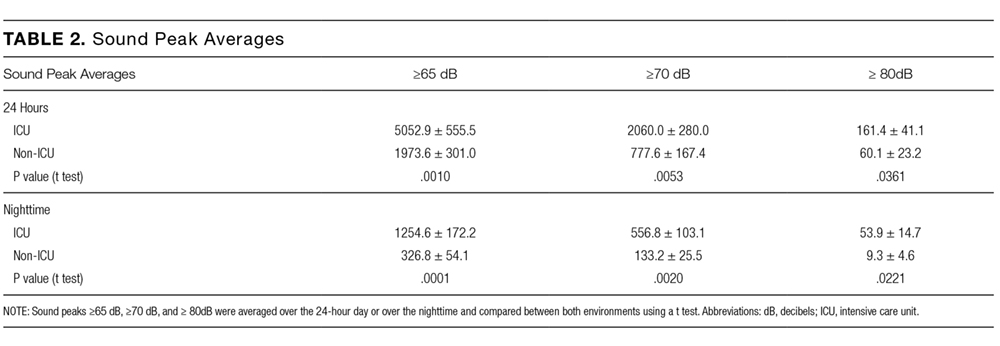
Data from ICU versus non-ICU rooms were analyzed for the number of sound peaks throughout the 24-hour day and for sound peak over the nighttime, defined as the number of times sound levels exceeded 65 dB, 70 dB, or 80 dB, which were averaged over 24 hours and over the nighttime (10 PM to 6 AM). We also calculated the number of average SLCs ≥17.5 dB observed over 24 hours and over the nighttime.
Light Measurements
Light meters measured luminescence in lux at a frequency of 120 seconds. We averaged individual data points to obtain hourly averages for ICU and non-ICU rooms. In addition to hourly averages, light-level data were analyzed for maximum levels throughout the day and night.
Statistical Analysis
Hourly sound-level averages between the 3 floors were evaluated using a 1-way analysis of variance (ANOVA); sound averages from the general ward and telemetry floor were also compared at each hour using a Student t test. Light-level data, sound-level peak data, as well as SLC data were also evaluated using a Student t test.
RESULTS
Sound Measurements
Examples of the raw data distribution for individual sound recordings in an ICU and non-ICU room are shown in Figure 1A and 1B. Sound-level analysis with specific average values and significance levels between ICU and non-ICU rooms (with non-ICU rooms further divided between telemetry and general ward floors for purposes of hourly averages) are shown in Table 1. The average hourly values in all 3 locations were always above the 30-35 dB level (nighttime and daytime, respectively) recommended by the WHO (Figure 1C). A 1-way ANOVA analysis revealed significant differences between the 3 floors at all time points except for 10 AM. An analysis of the means at each time point between the telemetry floor and the general ward floor showed that the telemetry floor had significantly higher sound averages compared with the general ward floor at 10 PM, 11 PM, and 12 AM. Sound levels dropped during the nighttime on both non-ICU wards but remained fairly constant throughout the day and night in the ICU.
Importantly, despite average and peak sound levels showing that the ICU environment is louder overall, there were an equivalent number of SLCs ≥ 17.5 dB in the ICU and on non-ICU floors. The number of SLCs ≥ 17.5 dB is not statistically different when comparing ICU and non-ICU rooms either averaged over 24 hours or averaged over the nighttime (Figure 1E).
Light Measurements
Examples of light levels over a 24-hour period in an ICU and non-ICU room are shown in Figure 2A and 2B, respectively. Maximum average light levels (reported here as average value ± standard deviation to demonstrate variability within the data) in the ICU were 169.7 ± 127.1 lux and occurred at 1 PM, while maximum average light levels in the non-ICU rooms were 213.5 ± 341.6 lux and occurred at 5 PM (Figure 2C). Average light levels in the morning hours remained low and ranged from 15.9 ± 12.7 lux to 38.9 ± 43.4 lux in the ICU and from 22.3 ± 17.5 lux to 100.7 ± 92.0 lux on the non-ICU floors. The maximum measured level from any of the recordings was 2530 lux and occurred in a general ward room in the 5 PM hour. Overall, light averages remained low, but this particular room had light levels that were significantly higher than the others. A t test analysis of the hourly averages revealed only 1 time point of significant difference between the 2 floors; at 7 AM, the general ward floor had a higher lux level of 49.9 ± 27.5 versus 19.2 ± 10.7 in the ICU (P = 0.038). Otherwise, there were no differences between light levels in ICU rooms versus non-ICU rooms. Evaluation of the data revealed a substantial amount of variability in light levels throughout the daytime hours. Light levels during the nighttime remained low and were not significantly different between the 2 groups.