Influenza Season Hospitalization Trends in Israel: A Multi-Year Comparative Analysis 2005/2006 Through 2012/2013


BACKGROUND: Influenza-related morbidity impacts healthcare systems, including hospitals.
OBJECTIVE: To obtain a quantitative assessment of hospitalization burden in pediatric and internal medicine departments during influenza seasons compared with the summer months in Israel.
METHODS: Data on pediatric and internal medicine hospitalized patients in general hospitals in Israel during the influenza seasons between 2005 and 2013 were analyzed for rate of hospitalizations, rate of hospitalization days, hospital length of stay (LOS), and bed occupancy and compared with the summer months. Data were analyzed for hospitalizations for all diagnoses, diagnoses of respiratory or cardiovascular disease (ICD9 390-519), and influenza or pneumonia (ICD9 480-487), with data stratified by age. The 2009-2010 pandemic influenza season was excluded.
RESULTS: Rates of monthly hospitalizations and hospitalization days for all diagnoses were 4.8% and 8% higher, respectively, during influenza seasons as compared with the summers. The mean LOS per hospitalization for all diagnoses demonstrated a small increase during influenza seasons as compared with summer seasons. The excess hospitalizations and hospitalization days were especially noticed for the age groups under 1 year, 1-4 years, and 85 years and older. The differences were severalfold higher for patients with a diagnosis of respiratory or cardiovascular disease and influenza or pneumonia. Bed occupancy was higher during influenza seasons compared with the summer, particularly in pediatric departments.
CONCLUSIONS: Hospital burden in pediatric and internal medicine departments during influenza seasons in Israel was associated with age and diagnosis. These results are important for optimal preparedness for influenza seasons.
© 2017 Society of Hospital Medicine
Hospitalizations. Mean monthly rate of hospitalizations during influenza and summer seasons was calculated by dividing the sum of hospital discharge rates during influenza/summer seasons of the entire evaluation period (2005/2006 to 2012/2013) by the number of influenza/summer activity months of that period.
Hospitalization Days. The measure “hospitalization days” refers to the hospitalization days of all patients who were discharged during influenza seasons. Mean monthly rate of hospitalization days during the influenza season and summer season was calculated using the procedure described for monthly mean rate of hospitalizations.
Length of Stay. The measure “length of stay” refers to the number of days that individual patients stayed in the hospital during an admission in the evaluated seasons.
Mean monthly LOS during the influenza and summer seasons for all patients (in both internal medicine and pediatric departments) and by age group was calculated by dividing the sum of monthly LOS during influenza seasons/summer season of the entire evaluation period (2005/2006 to 2012/2013 except for the 2009/2010 season) by the number of influenza/summer activity months of that period.
LOS for each specific month of the evaluation period for a single patient was calculated by dividing the number of hospitalization days of all patients that were discharged that month (stratified by age group) by the number of discharges in the same month.
Bed Occupancy. Bed occupancy rates for internal medicine and pediatric departments of the seasons evaluated were computed as a weighted rate based on the hospitalization days and licensed inpatient beds for the period of each influenza and summer season. The calculation took into account the number of days of each month and was based on the monthly reporting of hospital inpatient days in these departments and on the number of inpatient beds according to standard license documents issued by the MOH for each hospital.
Difference Between Influenza and Summer Seasons. Differences in mean monthly rates of hospitalizations, mean monthly rate of hospitalization days, and LOS during influenza seasons and the preceding summer were calculated as absolute numbers per month and as a percentage. The difference between bed occupancy during the influenza seasons and the preceding summers was expressed in percentage. Differences were computed for all diagnoses and for ICD9 480-487 and 390-519.
Statistical Analysis
Mean and standard deviation for monthly hospitalization rates, rates of monthly hospitalization days, and for LOS were calculated for all the influenza and summer seasons that were evaluated. Differences and statistical significance for these parameters were evaluated using a two-tailed Wilcoxon-Mann-Whitney test adjusted for ties, with 95% confidence interval for mean locations. The null hypothesis of the Wilcoxon test used was that the mean ranks of the influenza and summer season observations were equal.
Mean of bed occupancy percentage was calculated for influenza and summer seasons, with the difference and statistical significance being evaluated using a χ2 test. P value of < 0.05 was considered statistically significant. SAS Version 9.1 and R program version 3.3.1 software were used for analysis.
RESULTS
Influenza Seasons
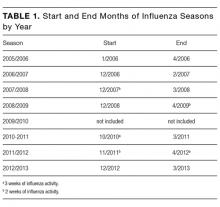
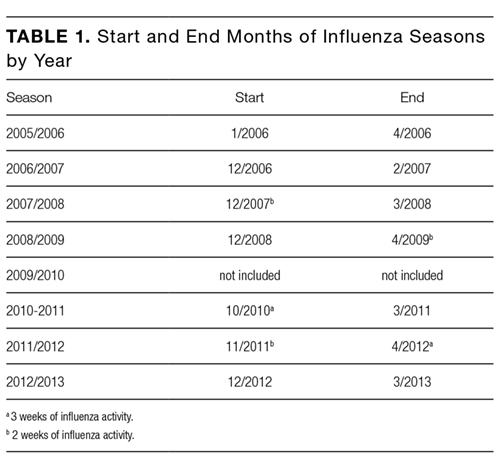
The length of influenza seasons varied, with the shortest season lasting 3 months (2006-2007) and the longest season lasting six months (2010-2011 and 2011-2012; Table 1). Of the 14 first and last months of the 7 influenza seasons, 9 had influenza activity throughout the month, 2 had 3 weeks of influenza activity, and 3 had 2 weeks of influenza activity (Table 1).
Hospitalizations
A total of 452,209 hospital discharges occurred in pediatric and internal medicine departments during the influenza seasons that were evaluated. The mean monthly rate of hospitalizations (as defined in M
The mean monthly rate of hospitalizations for all ages due to the diagnosis of respiratory/cardiovascular diseases and influenza/pneumonia was 18.6% and 60.8% higher, respectively, during influenza seasons compared with the preceding summers (panels B and C in Figure). These differences were statistically significant (panels B and C in Figure; Supplementary Table 1).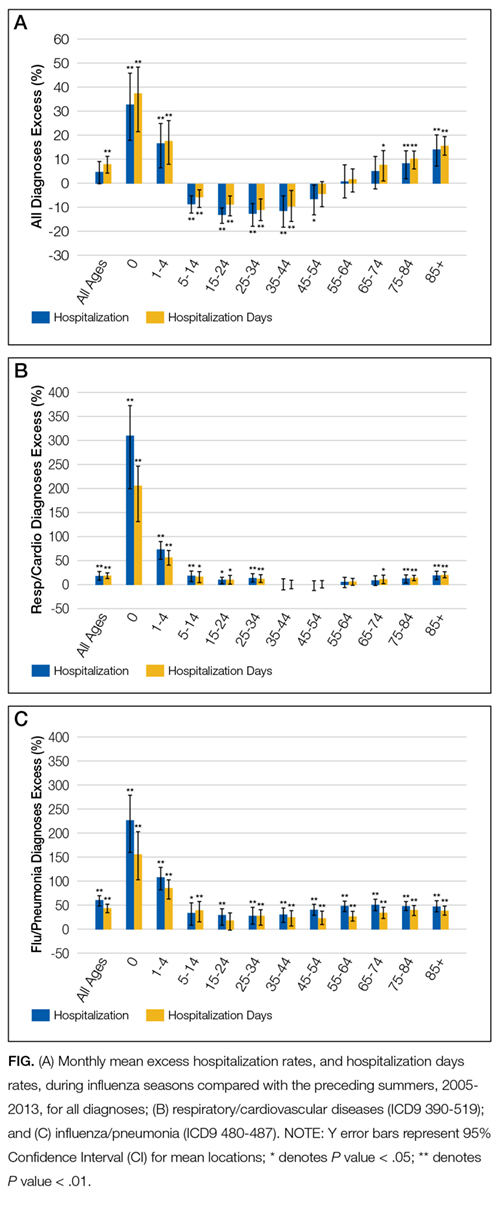
The increase in mean monthly hospitalization rates for patients with a diagnosis of respiratory/cardiovascular diseases and pneumonia/influenza was highest among infants <1 year and children aged 1-4 years (panels B and C in Figure; Supplementary Table 1). Increases were also observed among other age groups. However, they were more modest and reached statistical significance for respiratory/cardiovascular diseases in the age groups of ≤34 years and ≥75 years (panel B in Figure; Supplementary Table 1). The increases in mean monthly hospitalization rates for pneumonia/influenza were statistically significant in all age groups and were greater than 40% among adults ≥55 years (panel C in Figure; Supplementary Table 1).
Statistically significant decreases in mean monthly hospitalization rates during influenza seasons were observed for all diagnoses in the 5-54 age groups (panel A in Figure; Supplementary Table 1). Decreases were not seen for the diagnoses of respiratory/cardiovascular diseases or pneumonia/influenza (panels B and C in Figure; Supplementary Table 1).
