Hospital-level factors associated with pediatric emergency department return visits
BACKGROUND
Return visits (RVs) and RVs with admission (RVAs) are commonly used emergency department quality measures. Visit- and patient-level factors, including several social determinants of health, have been associated with RV rates, but hospital-specific factors have not been studied.
OBJECTIVE
To identify what hospital-level factors correspond with high RV and RVA rates.
SETTING
Multicenter mixed-methods study of hospital characteristics associated with RV and RVA rates.
DATA SOURCE
Pediatric Health Information System with survey of emergency department directors.
MEASUREMENTS
Adjusted return rates were calculated with generalized linear mixed-effects models. Hospitals were categorized by adjusted RV and RVA rates for analysis.
RESULTS
Twenty-four hospitals accounted for 1,456,377 patient visits with an overall adjusted RV rate of 3.7% and RVA rate of 0.7%. Hospitals with the highest RV rates served populations that were more likely to have government insurance and lower median household incomes and less likely to carry commercial insurance. Hospitals in the highest RV rate outlier group had lower pediatric emergency medicine specialist staffing, calculated as full-time equivalents per 10,000 patient visits: median (interquartile range) of 1.9 (1.5-2.1) versus 2.9 (2.2-3.6). There were no differences in hospital population characteristics or staffing by RVA groups.
CONCLUSION
RV rates were associated with population social determinants of health and inversely related to staffing. Hospital-level variation may indicate population-level economic factors outside the control of the hospital and unrelated to quality of care. Journal of Hospital Medicine 2017;12:536-543. © 2017 Society of Hospital Medicine
© 2017 Society of Hospital Medicine
RESULTS
Return Visit Rates and Hospital ED Site Population Characteristics
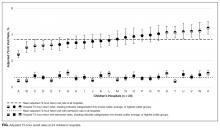
Twenty-four of 35 (68%) eligible hospitals that met PHIS quality control standards for ED patient visits responded to the ED medical director survey. The included hospitals that both met quality control standards and completed the survey had a total of 1,456,377 patient visits during the study period. Individual sites had annual volumes ranging from 26,627 to 96,637 ED encounters. The mean RV rate across the institutions was 3.7% (range, 3.0%-4.8%), and the mean RVA rate across the hospitals was 0.7% (range, 0.5%-1.1%) (Figure).
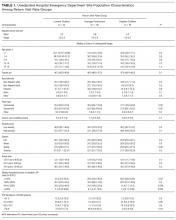
There were 5 hospitals with RV rates less than 2 SDs of the mean rate, placing them in the lowest outlier group for RV; 13 hospitals with RV rates within 2 SDs of the mean RV rate, placing them in the average-performing group; and 6 hospitals with RV rates above 2 SDs of the mean, placing them in the highest outlier group. Table 1 lists the hospital ED site population characteristics among the 3 RV rate groups. Hospitals in the highest outlier group served populations with higher proportions of patients with insurance from a government payer, lower proportions of patients covered by a commercial insurance plan, and higher proportion of patients with lower median household incomes.
In the RVA analysis, there were 6 hospitals with RVA rates less than 2 SDs of the mean RVA rate (lowest outliers); 14 hospitals with RVA rates within 2 SDs of the mean RVA rate (average performers); and 4 hospitals with RVA rates above 2 SDs of the mean RVA rate (highest outliers). When using these groups based on RVA rate, there were no statistically significant differences in hospital ED site population characteristics (Supplemental Table 1).
RV Rates and Hospital-Level Factors Survey Characteristics
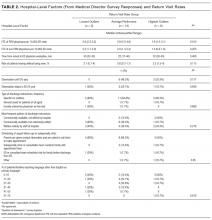
Table 2 lists the ED medical director survey hospital-level data among the 3 RV rate groups. There were fewer FTEs by PEM fellowship-trained physicians per 10,000 patient visits at sites with higher RV rates (Table 2). Hospital-level characteristics assessed by the survey were not associated with RVA rates (Supplemental Table 2).
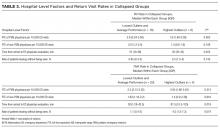
Evaluating characteristics of hospitals with the most potential to gain from improvement, hospitals with the highest RV rates (highest outlier group), compared with hospitals in the lowest outlier and average-performing groups collapsed together, persisted in having fewer PEM fellowship-trained physician FTEs per patient visit (Table 3). A similar collapsed analysis of RVA rates demonstrated that hospitals in the highest outlier group had longer-wait-to-physician time (81 minutes; IQR, 51-105 minutes) compared with hospitals in the other 2 groups (30 minutes; IQR, 19-42.5 minutes) (Table 3).
In response to the first qualitative question on the ED medial director survey, “In your opinion, what is the largest barrier to reducing the number of return visits within 72 hours of discharge from a previous ED visit?”, 15 directors (62.5%) reported limited access to primary care, 4 (16.6%) reported inadequate discharge instructions and/or education provided, and 3 (12.5%) reported lack of access to specialist care. To the second question, “In your opinion, what is the best way of reducing the number of the return visits within 72 hours of previous ED visit for the same condition?”, they responded that RVs could be reduced by innovations in scheduling primary care or specialty follow-up visits (19, 79%), improving discharge education and instructions (6, 25%), and identifying more case management or care coordination (4, 16.6%).
DISCUSSION
Other studies have identified patient- and visit-level characteristics associated with higher ED RV and RVA rates.3,8,9,31 However, as our goal was to identify possible modifiable institutional features, our study examined factors at hospital and population-served levels (instead of patient or visit level) that may impact ED RV and RVA rates. Interestingly, our sample of tertiary-care pediatric center EDs provided evidence of variability in RV and RVA rates. We identified factors associated with RV rates related to the SDHs of the populations served by the ED, which suggests these factors are not modifiable at an institution level. In addition, we found that the increased availability of PEM providers per patient visit correlated with fewer ED RVs.
Hospitals serving ED populations with more government-insured and fewer commercially insured patients had higher rates of return to the ED. Similarly, hospitals with larger proportions of patients from areas with lower median household incomes had higher RV rates. These factors may indicate that patients with limited resources may have more frequent ED RVs,3,6,32,33 and hospitals that serve them have higher ED RV rates. Our findings complement those of a recent study by Sills et al.,11 who evaluated hospital readmissions and proposed risk adjustment for performance reimbursement. This study found that hospital population-level race, ethnicity, insurance status, and household income were predictors of hospital readmission after discharge.
Of note, our data did not identify similar site-level attributes related to the population served that correlated with RVA rates. We postulate that the need for admission on RV may indicate an inherent clinical urgency or medical need associated with the return to the ED, whereas RV without admission may be related more to patient- or population-level sociodemographic factors than to quality of care and clinical course, which influence ED utilization.1,3,30 EDs treating higher proportions of patients of minority race or ethnicity, those with fewer financial resources, and those in more need of government health insurance are at higher risk for ED revisits.
We observed that increased PEM fellowship-trained physician staffing was associated with decreased RV rates. The availability of specialty-trained physicians in PEM may allow a larger proportion of patients treated by physicians with honed clinical skills for the patient population. Data from a single pediatric center showed PEM fellowship-trained physicians had admission rates lower than those of their counterparts without subspecialty fellowship training.34 The lower RV rate for this group in our study is especially interesting in light of previously reported lower admission rates at index visit in PEM trained physicians. With lower index admission rates, it may have been assumed that visits associated with PEM trained physician care would have an increased (rather than decreased) chance of RV. In addition, we noted the increased RVA rates were associated with longer waits to see a physician. These measures may indicate the effect of institutional access to robust resources (the ability to hire and support more specialty-trained physicians). These novel findings warrant further evaluation, particularly as our sample included only pediatric centers.
Our survey data demonstrated the impact that access to care has on ED RV rates. The ED medical directors indicated that limited access to outpatient appointments with PCPs and specialists was an important factor increasing ED RVs and a potential avenue for interventions. As the 2 open-ended questions addressed barriers and potential solutions, it is interesting that the respondents cited access to care and discharge instructions as the largest barriers and identified innovations in access to care and discharge education as important potential remedies.
This study demonstrated that, at the hospital level, ED RV quality measures are influenced by complex and varied SDHs that primarily reflect the characteristics of the patient populations served. Prior work has similarly highlighted the importance of gaining a rigorous understanding of other quality measures before widespread use, reporting, and dissemination of results.11,35-38 With this in mind, as quality measures are developed and implemented, care should be taken to ensure they accurately and appropriately reflect the quality of care provided to the patient and are not more representative of other factors not directly within institutional control. These findings call into question the usefulness of ED RVs as a quality measure for comparing institutions.


