Hospital-based clinicians’ use of technology for patient care-related communication: a national survey
OBJECTIVE
To characterize current use of communication technologies, including standard text messaging and secure mobile messaging applications, for patient care–related (PCR) communication.
METHODS
We used a Society of Hospital Medicine database to conduct a national cross-sectional survey of hospital-based clinicians.
RESULTS
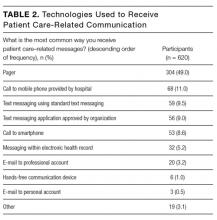
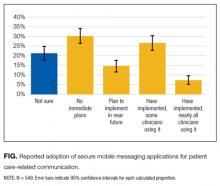
We analyzed data from 620 survey respondents (adjusted response rate, 11.0%). Pagers were provided by hospitals to 495 (79.8%) of these clinicians, and 304 (49%) of the 620 reported they received PCR messages most commonly by pager. Use of standard text messaging for PCR communication was common, with 300 (52.9%) of 567 clinicians reporting receipt of standard text messages once or more per day. Overall, 21.5% (122/567) of respondents received standard text messages that included individually identifiable information, 41.3% (234/567) received messages that included some identifiable information (eg, patient initials), and 21.0% (119/567) received messages for urgent clinical issues at least once per day. About one-fourth of respondents (26.6%, 146/549) reported their organization had implemented a secure messaging application that some clinicians were using, whereas few (7.3%, 40/549) reported their organization had implemented an application that most clinicians were using.
DISCUSSION
Pagers remain the technology most commonly used by hospital-based clinicians, but a majority also use standard text messaging for PCR communication, and relatively few hospitals have fully implemented secure mobile messaging applications.
CONCLUSION
The wide range of technologies used suggests an evolution of methods to support communication among healthcare professionals. Journal of Hospital Medicine 2017;12:530-535. © 2017 Society of Hospital Medicine
© 2017 Society of Hospital Medicine
Sampling Strategy
We used the largest hospitalist database maintained by the Society of Hospital Medicine (SHM). This database includes information on more than 28,000 individuals, representing SHM members and nonmembers who had participated in organizational events. In addition to clinically active hospitalists, the database includes non-hospitalists and clinically inactive hospitalists. We used this database to try to capture the largest possible number of potentially eligible hospitalists.
Survey Administration
We administered the survey in collaboration with SHM staff. E-mails that included a link to the survey on the Survey Monkey website were sent by SHM staff to individuals within the database. These e-mails were sent through Real Magnet, an e-mail marketing platform8 that allowed the SHM staff to determine the number of individuals who received and opened the e-mail and the number who clicked on the survey link. To try to promote participation, we offered respondents the chance to enter a lottery to win one of four $50 gift certificates. The initial e-mail was sent in April 2016, a reminder in May 2016, and a final reminder in July 2016.
Data Analysis
We calculated descriptive statistics of participants’ demographic characteristics. We estimated nonresponse bias by comparing demographic characteristics across waves of respondents using analysis of variance, t tests, and χ2 tests. This method is based on the finding that characteristics of late respondents often resemble those of nonrespondents.9 We collapsed response categories for communication technologies to simplify interpretation. For example, numeric pagers, alphanumeric pagers, and 2-way pagers were collapsed into a pagers category. We used t tests and χ2 tests to assess for associations between receipt of standard text messages for PCR communication and respondents’ age, sex, race, professional type, hospital size, practice location, and hospital teaching status. Similarly, we used t tests and χ2 tests to explore associations between implementation of secure mobile messaging application and respondents’ age, sex, race, professional type, hospital size, practice location, and hospital teaching status. All statistical analyses were performed with Stata Release 11.2 (StataCorp).
RESULTS
Participant Characteristics
Overall, the survey link was sent to 28,870 e-mail addresses. Addresses for which e-mails were undeliverable or for which the e-mail was never opened were excluded, yielding a total of 5,786 eligible respondents in the sample. After rejecting 42 clinically inactive individuals, 70 individuals who responded to only the initial item, and 27 duplicates, a total of 620 participant surveys were included in the final analysis. The adjusted response rate was 11.0%.
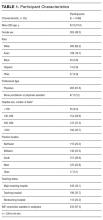
As shown in Table 1, mean (SD) respondent age was 42.9 (10.0) years, nearly half of the respondents were female, nearly a third were of nonwhite race, an overwhelming majority were physicians, and workplaces were in a variety of hospital settings. The sample size used to calculate demographic characteristics varied from 538 to 549 because of missing data for these items. We found no significant differences in demographic characteristics of respondents across the 3 survey waves, suggesting a lack of survey response bias (Supplemental Table).
Provision and Use of Communication Technologies for PCR Communication
Pagers were provided to the majority of respondents by their hospitals (79.8%, 495/620). Other devices were provided much less frequently, with 21.0% (130/620) reporting their organization provided a smartphone, 20.2% (125/620) a mobile phone, and 4.4% (27/620) a hands-free communication device. Organizations provided no device to 8.2% (51/620) of respondents and an “other” device to 5.5% (34/620).
An overwhelming majority used multiple technologies to receive PCR communication, with 17.7
Participants’ Experiences With Standard Text Messaging for PCR Communication
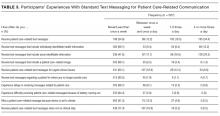
Participants’ experiences with standard text messaging for PCR communication are summarized in Table 3. Overall, 65.1% (369/ 567) of respondents reported receiving standard text messages for PCR communication at least once per week when on clinical duty, and 52.9% (300/567) received standard text messages at least once per day.
Overall, 21.5% (122/567) of respondents received standard text messages that included individually identifiable information at least once per day, and 41.3% (234/567) received messages that included some identifiable information (eg, patient initials, room number) at least once per day. About one-fifth of respondents (21.0%, 119/567) indicated receiving standard text messages for urgent clinical issues at least once per day. Receipt of standard text messages for a patient for whom the respondent was no longer providing care, delays in receipt of messages, messages missed because smartphones were set to vibrate, and receipt of messages when not on clinical duty occurred, but less frequently. We found no significant associations between receipt of PCR standard text messages once or more per day and respondents’ age, sex, race, professional type, hospital size, or hospital teaching status. A higher percentage of respondents in the South (63.2%, 96/152) and West (57.9%, 70/121) reported receipt of at least 1 PCR standard text message per day, compared with respondents in the Northeast (51.9%, 54/104), Midwest (45.2%, 61/135), and other (25.0%, 4/16) (P = 0.003).
Senders of PCR standard text messages. Of respondents who received standard text messages for PCR communication at least once per week, a majority reported receiving messages from physicians in the same specialty (88.6%, 327/369) and from physicians in other specialties (71.3%, 263/369). A minority of respondents reported receiving messages from nurses (35.0%, 129/369), social workers (30.6%, 113/369), and pharmacists (27.9%, 103/369).
Perceptions among users. Of respondents who received standard text messages for PCR communication at least once per week, an overwhelming majority agreed or strongly agreed that use of standard text messaging allowed them to provide better care (81.7%, 295/361) and made them more efficient (87.3%, 315/361). A majority also agreed or strongly agreed that standard text messaging posed a risk to the privacy and confidentiality of patient information (56.4%, 203/360), and nearly a third indicated that standard text messaging posed a risk to the timely receipt of messages by the correct individual (27.6%, 100/362). Overall, a large majority agreed or strongly agreed that the benefits of using standard text messaging for PCR communication outweighed the risks (85.0%, 306/360).


