Which tympanometer is optimal for an outpatient primary care setting?


Four models out of 16 made the cut for best in field.
When other units may be preferable
If a handheld tympanometer with a docking station is necessary, then the MT10 or GSI 37 would be an appropriate choice.
MT10. This unit received the highest overall user ratings, slightly higher than the Earscan. The MT10 has a larger monitor and better control features than the GSI 37. It also has the capability for computer integration. However, the MT 10 gave less consistent readings for same-ear measurements when compared with the Earscan and GSI 37.
GSI 37. This unit provided more consistent pressure and compliance readings than the MT 10, and had no glare on its screen. It also has a longer track record in the field than does the newer MT10. It has an excellent operation manual.
In vitro testing for volume using a fixed object (calibration tube) demonstrated excellent reproducibility. There was little to no variation for 10 consecutive measurements for each tympanometer. In vivo reproducibility testing was performed taking 3 consecutive readings on each of 5 different ears using the tympanometers. For Compliance and Pressure readings the Earscan showed the most consistency while the MT 10 showed the least (TABLE 2).
Compliance data is graphed from 1 left ear to portray the range of values obtained from 4 tympanometers (FIGURE 1). While all tympanometers gave normal compliance readings, some units were less consistent than others. The MT10 showed the widest range of readings (least consistency). For this patient’s right ear (not shown), 3 tympanometers identified an overly compliant ear drum, while the MT10 gave normal and close to normal values. The MicroTymp 2 did not provide a compliance reading for the right ear.
Middle ear pressure data is graphed from the same left ear to portray the range of values obtained from 4 tympanometers (FIGURE 2). Overall, the units gave values that were within the clinically acceptable range of normal. However, there was a wide range of readings from the MT10 and MicroTymp 2. Assuming the participants’ middle ear pressure was truly close to zero, the outlier values reported by the MT10 and MicroTymp 2 might have clinical significance.
More than 100 tympanograms were obtained on children and adults; observations were noted. The Earscan, GSI 37 and MT 10 were easier to use and to obtain a good seal. The MicroTymp 2 proved more difficult to obtain a seal with and at times presented a falsely positive flat tympanogram. Earscan and MT10 gave similar readings on several occasions. On several occasions, the MicroTymp 2 and GSI 37 values significantly disagreed with each other. At times the MicroTymp 2 provided a graphical tympanogram but did not provide the numerical data. It was also easy to inadvertently combine previous data from one ear with new data from contralateral ear when using the MicroTymp 2.
Earscan tympanograms and corresponding video otoscope images are shown in FIGURE 3. The right tympanogram (bottom) is consistent with the video otoscope findings of otitis media. Observe the low compliance, elevated middle ear pressure, and low physical volume. The normal left tympanogram and otoscopy are concordant.
User ratings are shown in TABLE 3. Overall, participants ranked the MT10 highest (56.3) with the Earscan second (54.9), GSI 37 third (50.4), and MicroTymp 2 fourth (46.0). The MT10 rated highest in Ergonomics, Ease of Use of Control Features, Screen, Accessories, Appearance, Size and Information Layout. The Earscan rated highest in Overall Ease of Use and Perceived Durability. The MT10 and Earscan were tied for Capabilities and Interfacing. The MT10, GSI 37 and Earscan were tied for Perceived Data Quality. The GSI 37 was rated highest in Perceived Maintenance. Seven out of 8 reviewers (2 ties with the MT10) selected the Earscan as easiest to use. Eight out of eight (2 ties with MT10) selected the Earscan as the most simple to obtain a good seal.
The features representing the main differences between the 4 tympanometers are listed on pages 951 and 952. Features are identified as positive or negative and ranked according to how they impacted the final selection from most influential to least.
FIGURE 1
Compliance data obtained from 4 tympanometers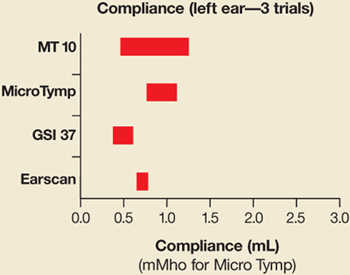
While all 4 gave normal readings, the MT10 showed the least consistency.
FIGURE 2
Middle ear pressure data obtained from 4 tympanometers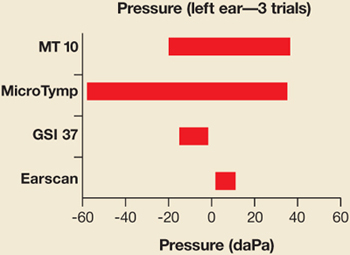
All 4 units gave values within normal range; there was a wide range from the MT10 and MicroTymp2.
FIGURE 3
Earscan tympanograms agree with corresponding video otoscope images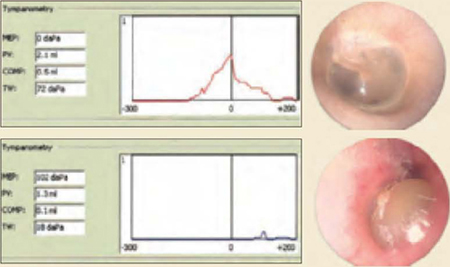
Top: Earscan demonstrating a normal left tympanogram and corresponding video otoscope image.
Bottom: Earscan demonstrating an abnormal right tympanogram with elevated middle ear pressure, reduced compliance and reduced physical volume. The video otoscope image is consistent with otitis media.