Pharmacist Management of Adult Asthma at an Indian Health Service Facility
A pharmacist-managed adult asthma clinic improved asthma outcomes, patient satisfaction, cost burden, and readmission rates at the Shiprock, New Mexico, Indian Health Service facility.
All patients seen at the clinic were tracked in a database, and their current level of control was documented at each visit. To determine the level of control, the database was reviewed, and those patients with > 1 visit were included in the analysis. The levels of control from the first visit to the most recent visit were compared.
Patient surveys were completed at each visit. These surveys included questions to assist the pharmacy provider in classifying the level of control, patient satisfaction with asthma care, and patient perception of asthma control. Approval from the Navajo Area Institutional Review Board was obtained for data publication. Odds ratios were used to determine the impact of the clinic, using a 95% confidence interval.
Results
For the review period, 2,997 patients were coded as having some form of asthma, resulting in 12,739 asthma visits within the medical center.
ED Visits and Hospital Admissions
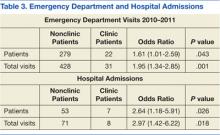
Of these 2,997 patients, 301 visited the ED between 2010 and 2011 with 22 being active asthma clinic patients. These 22 active clinic patients accounted for 31 ED visits. The remaining 279 patients had 428 visits with a total of 459 ED visits from clinic and nonclinic patients. Sixty patients were hospitalized for asthma with 7 of them active asthma clinic patients. The 7 clinic patients admitted accounted for 8 admissions. There is a statistical significance in total ED visits and admissions as well as for individual patients (Table 3).
To determine the clinic impact, a 2-year analysis of patient pre- and postclinic enrollment was done. Search criteria for RPMS VGEN were identical to the study period search except for dates. Those patients enrolled in the clinic during the study period (2010-2011) were evaluated for the 2 years before the clinic startup (2008-2009). The results indicated a decrease in both ED visits and hospital admissions related to asthma for clinic patients (Table 4).
Cost Data and Length of Stay
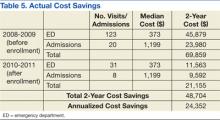
Emergency department and hospital admissions costs were determined from an earlier performance improvement review of the clinic. The median cost of an ED visit was $373 with a range from $228 to $910. The cost range represented the severity of the asthma exacerbation being treated. This cost range was similar to published data that reported a cost range from $234 to $400 with an average of $339 per visit.20,21 Hospital costs (including ED visit) per day ranged from $528 to $2,470 with a median of $1,199 per day. Table 5 shows the calculated actual annual cost savings for patients pre- and postenrollment. The cost difference between clinic and nonclinic patients from 2010 to 2011 was calculated to be $111,000 annually (data not shown). The median length of the hospital stay for clinic and nonclinic patients was 2 days (range, 1-10 and 1-7 days, respectively). The national average was 4.3 days.
From 2008 to 2009, there were 123 ED visits and 20 hospital admissions related to asthma of patients who would later be enrolled in the asthma clinic study. From 2010 to 2011 there were 31 ED visits and 8 hospital asthma admissions
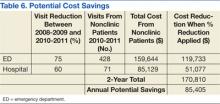
(Table 4). These data were used to determine the potential cost savings for the clinic (Table 5). Based on current reductions, the potential annual cost savings was $85,405 if all adult asthma patients were seen in the pharmacy managed clinic (Table 6).
Level of Control
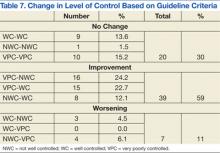
A total of 66 patients had 3 or more visits to the asthma clinic. Of these patients, 30% had no change in control, 60% showed some measure of improvement, and 11% had a decrease in control based on the national guidelines (Table 7).
Patient Perception
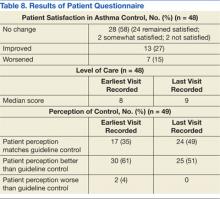
At each visit, the patient’s current perception of asthma control, satisfaction with control, and clinic grade related to asthma care was determined. Of the 66 patients with 3 or more visits, a large portion of the questionnaires were missing when the data were collected. Table 8 shows the results of the data for patients with 3 more visits and 2 completed forms from different visits. These data points may not have been from the first or most recent visits.
From earliest to most recent visit, patient perception of asthma control compared with clinical guidelines improved moderately. Sixteen patients had a clinical improvement from VPC to NWC with 13 (81%) believing their symptoms were now WC.
Discussion
The results of this performance improvement evaluation are encouraging. However, not all positive data may be directly attributed to the asthma clinic. The statistical analysis for this study does not seek to remove confounding variables. Without removing potential confounding variables, questions remain about the accuracy of the outcome. However, combining the statistical data in Table 3 and the 2-year comparative data in Table 4, strong evidence exists that a positive impact from the clinic had occurred even in the presence of potential confounding variables.


