Treatment Facility: An Important Prognostic Factor for Dedifferentiated Liposarcoma Survival


A National Cancer Database study of on survival outcomes for patients with dedifferentiated liposarcomas found that insurance status, median household income, and treatment facility were associated with differences in median survival and 5- and 10-year survival probabilities.
Continuous variables are presented as median and interquartile range (IQR) whereas categorical variables are presented as frequencies and proportion. IBM SPSS version 25.0 was used to produce Kaplan-Meier survival curves and descriptive statistics. This study used Kaplan- Meier survival tables and log-rank tests to analyze both the 5- and 10-year OS rates for the 5 variables listed above. This study also used a multivariable Cox regression model that accommodated the correlative nature of outcomes within facilities to study the association of the treatment facility type and other socioeconomic factors, while controlling for age, race (which was collapsed into 3 categories), sex, primary site, tumor stage, and treatment approaches. The proportional hazards assumption was individually checked for all pertinent variables. Any patient records that were missing data were excluded from the multivariable Cox regression model, which was analyzed with SAS version 9.4 (Cary, NC). P < 0.05 was used to indicate statistical significance for all analyses.
Results
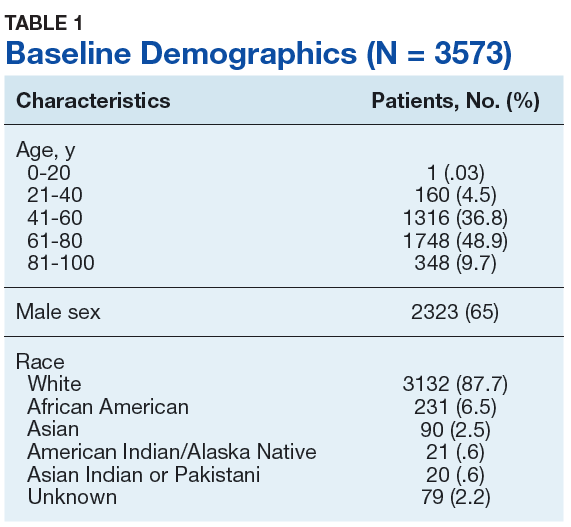
Table 1 provides descriptive analysis for demographic characteristics of the 3573 patients including age, sex, and race. The median age at diagnosis was 64 years. There were 1073 more men (65%) than women (35%) in this analysis. Whites were the predominant racial category, comprising 87.7% of the patient population, followed by African Americans (6.5%) and Asians (2.5%).
Socioeconomic Variables
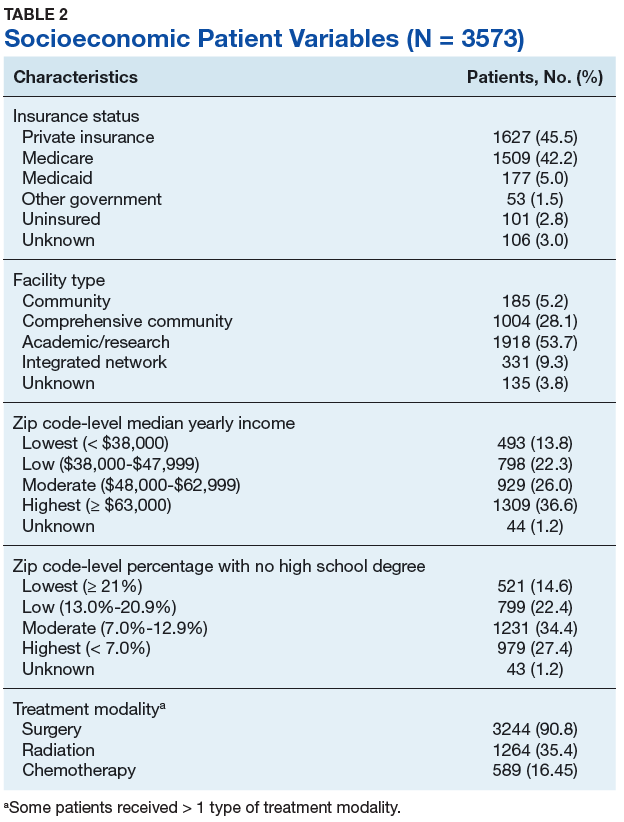
The largest proportion of the patient population (45.5%) had private insurance (Table 2). Medicare came in a close second covering almost 42.2% of the population, followed by Medicaid (5.0%), uninsured (2.8%), and other government insurance (1.5%). About half (53.7%) of the patients were treated at academic or research facilities, while the fewest number of patients (5.2%) underwent treatment at community cancer facilities. The largest percentage (36.6%) of patients lived in zip codes with the highest level of median household income, while 26.0% and 22.3% had moderate and low levels of income, respectively. About 14% of patients lived within an area of the lowest level of income. Similarly, almost 15% of patients lived in an area of lowest level of HS education. The greatest percentage of the patient population (34.5%) lived in a zip code with moderate level of HS education. Surgery was the most common treatment modality with 90.8% of the cohort undergoing surgery, while 35.4% and 16.5% were treated with radiation and chemotherapy, respectively (some patients received more than one type of treatment modality).
Survival Data
Survival data were available for 3112 patients. Kaplan-Meier survival curves were used to analyze OS according to insurance status, racial background, treatment facility type, median family income, and percentage of adults with no high school education. Overall 5- and 10- year OS probabilities were 51.5% and 34.8%, respectively, while the median OS (SD) was 63.57 (2.8) months (Table 3).
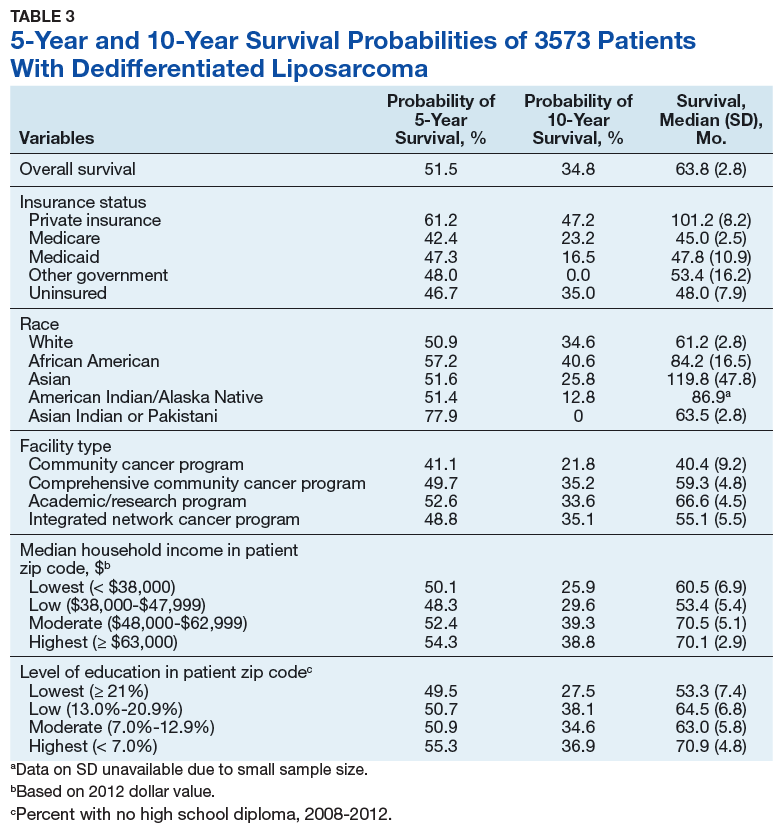
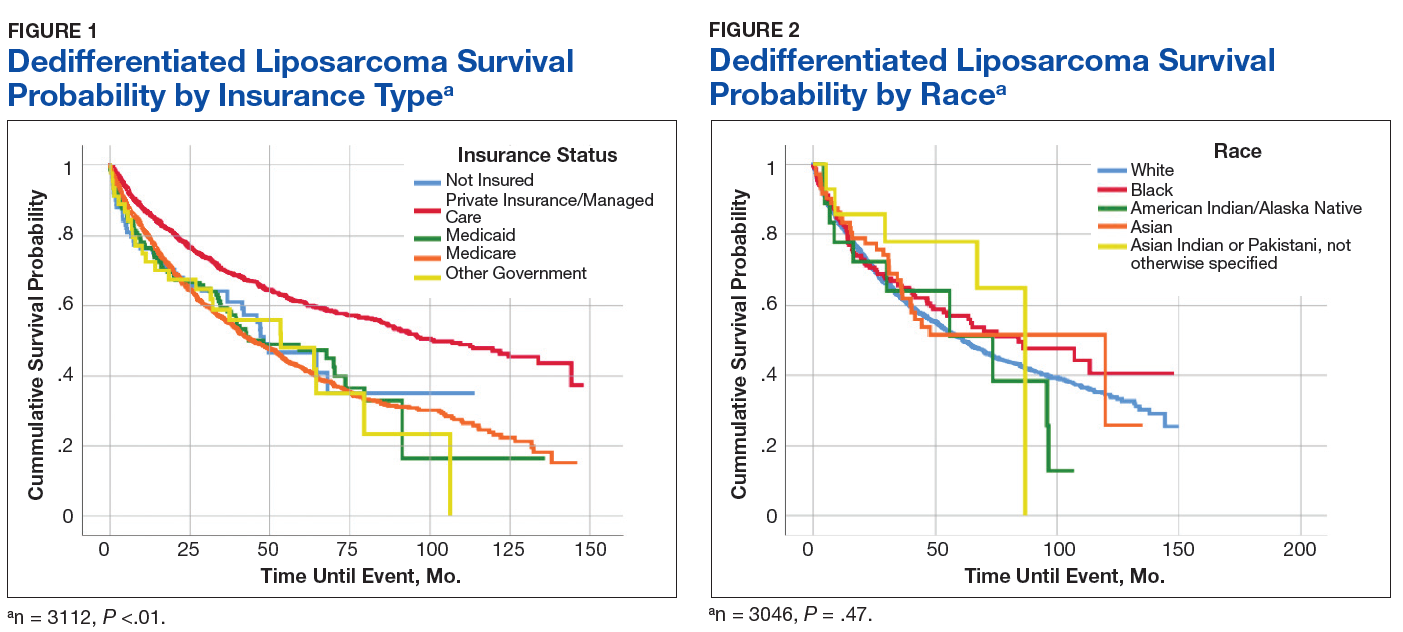
Private insurance showed significantly higher 5- and 10-year OS probabilities and median OS: 5-year OS was 61.2%, 10-year OS was 47.2%, and median survival (SD) was 101.2 (8.2) months compared with that of all other insurance groups (Medicare, Medicaid, other government insurance, and uninsured) (Figure 1). These other insurance types were fairly similar in their 5-year and median OS, but surprisingly, patients with no insurance had the second longest 10-year OS. The difference between the 5-year OS probabilities of private insurance compared with an average of the other insurances was 15.1%, which had almost doubled to 28.5% at 10 years, with a median OS difference of almost 5 years (56 months; data not shown).
Using the Kaplan-Meier survival curve, Asian Indians had the longest 5-year OS probability of 77.9% and African Americans had the longest 10-year OS probability of 40.6%. However, Asians as a group demonstrated the longest median (SD) OS outcome with 119.8 (47.8) months (Figure 2).
Overall, academic/research programs had the longest median OS and 5-year OS probability (SD) of 66.6 (4.5) months and 52.6%, respectively (Figure 3). Comprehensive community cancer programs and integrated network cancer programs had nearly identical 10-year OS rates (35.2% vs 35.1%, respectively). Community cancer programs had the worst 5- and 10-year OS probabilities (41.1% and 21.8%, respectively).
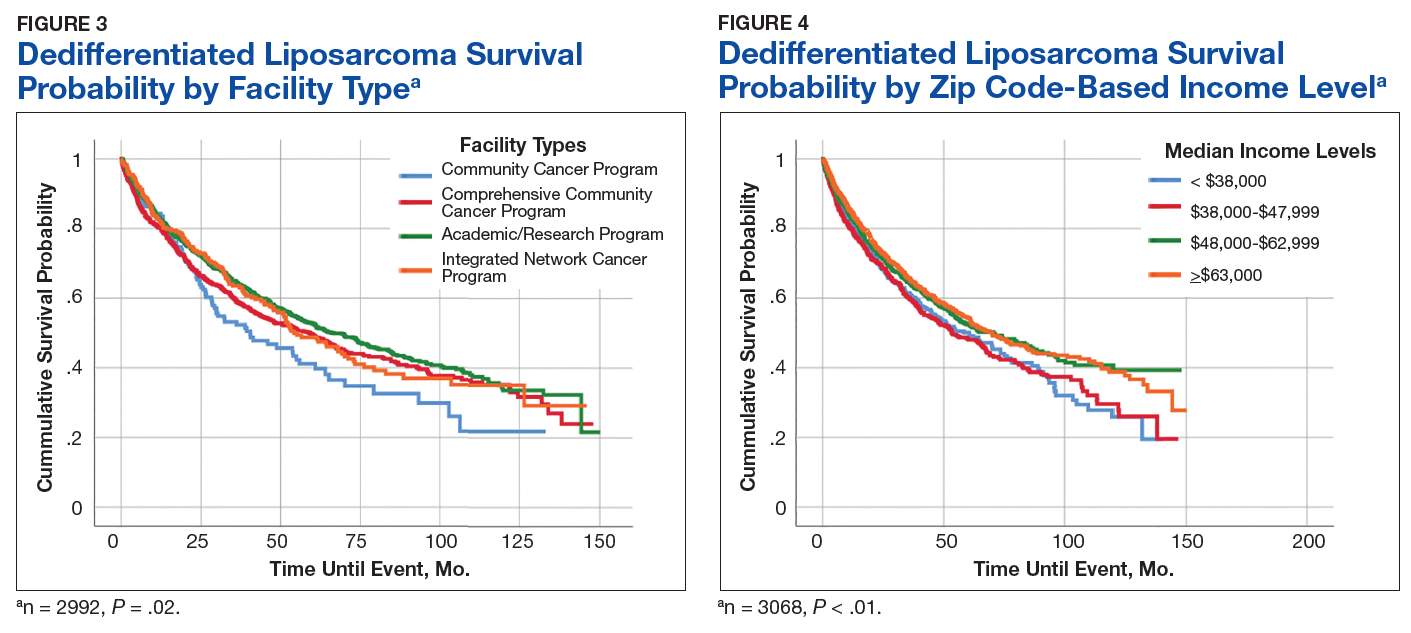
The top 2 income quartiles combined to demonstrate the longest median, 5-year, and 10-year OS probabilities and were very similar. Patients living in a zip code with the highest income level had the longest 5-year OS rates of 54.3%, while patients living in zip codes with a moderate income level had the longest 10-year OS at 39.3% and the longest median OS of about 71 months. Patients with the lowest level of median household income had the worst 5-year OS rates (48.3%) and a median (SD) OS of 53.4 (5.4) months (Figure 4).