Workforce Assessment of VA Home-Based Primary Care Pharmacists


Methods
The HBPC SME workgroup, in conjunction with CPPO, developed the assessment. Questions were designed and tested within a small group of CPSs and then distributed electronically. In August 2014, the assessment was e-mailed to all 21 VHA service areas with an active HBPC program, and responses were collected through a Microsoft SharePoint (Redmond, WA) survey. A response was requested from chiefs of pharmacy, clinical pharmacy leadership, or a representative.
This voluntary assessment contained 24 multipart questions related to background information of HBPC programs and clinical pharmacy services. Duplicate responses were consolidated and clarified with individual sites post hoc.
Descriptive statistics were used to analyze responses. To standardize the comparison across sites with a variety of full-time equivalent employees (FTEEs), the average patient census was divided by the CPS FTEE allocated to the programs at that site. For example, if a site reported 316 patients with 0.25 CPS FTEE, a standardized ratio for this site was 1,264 patients per FTEE. If a patient census range was reported, the median number would be used.
Results
The team received responses from 130 of 141 VHA facilities (92%), encompassing 270 CPSs. A total of 168.75 FTEEs were officially designated as HBPC CPSs. All 21 VHA service areas at the time were represented. The majority of responding programs (67%) had < 1 CPS FTEE allocated to HBPC; many of these CPSs were working in other pharmacy areas but were only dedicated to HBPC part-time. 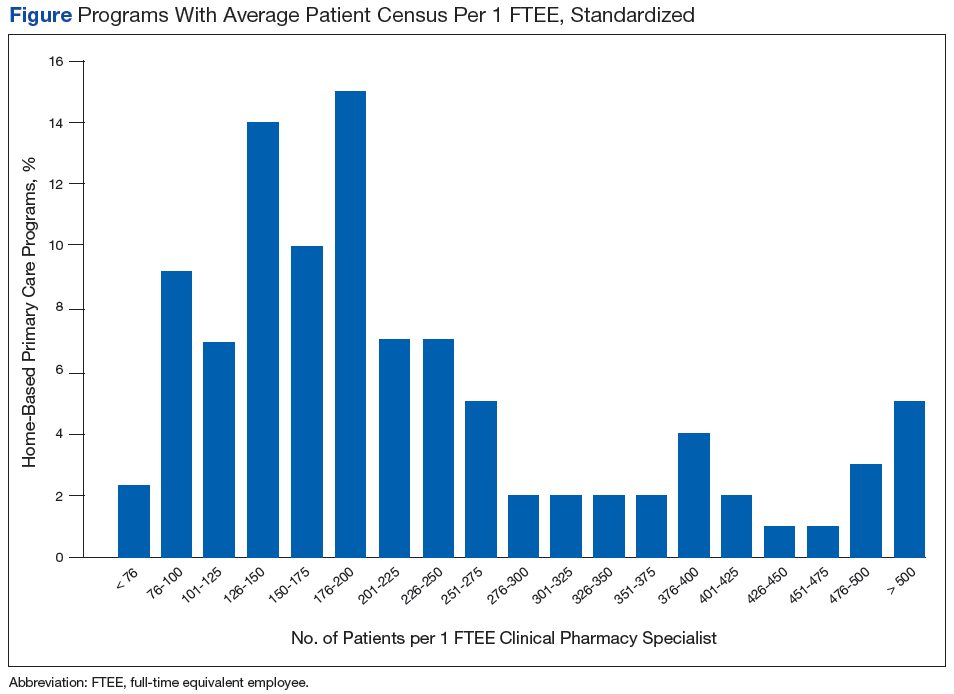
Nearly 90% of CPSs completed postgraduate year 1 residency training. Fifty-seven percent of CPSs held advanced certifications, such as BCGP, BCACP, or BCPS. Sixty-two percent of CPSs with these specialized board certifications had residency training. Use of a SOP was reported by 76% of CPSs, and 66% of these had a global practice-area scope. Table 1 outlines the functions authorized by a global or limited SOP.6 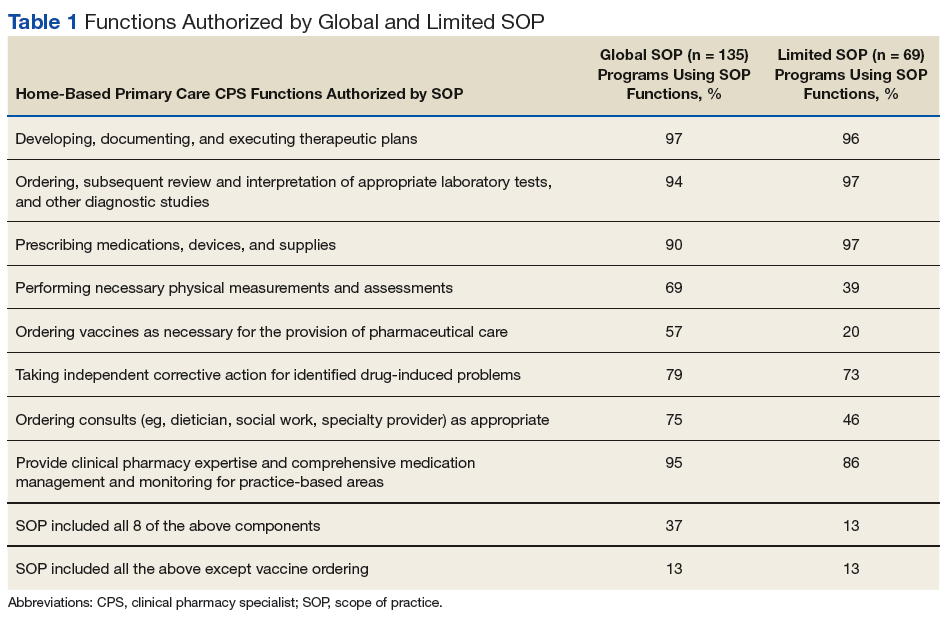
Overall, 52% of sites reported CPS involvement in CMM of primarily anticoagulation, diabetes mellitus (DM), anemia, hyperlipidemia, and hypertension. The reported average time spent for each disease encounter is delineated in Table 2. 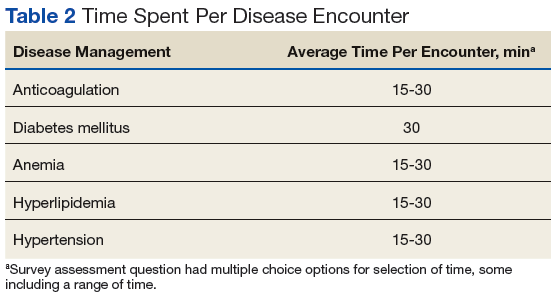
Thirty-five percent of sites reported CPS participation in home visits, and the majority of those completed between 1 and 10 home visits per month. The types of interventions provided often included medication education, assessment of medication adherence, and CMM for DM, hyperlipidemia, hypertension, etc. Multiple interventions often were made during each home visit.
The workload of medication reviews was divided among multiple CPSs in 55% of the programs. The majority of programs completed fewer than 20 initial medication reviews per month and between 21 and 80 quarterly medication reviews per month (81% and 62%, respectively). The average time for a CPS to complete initial medication reviews was 78 minutes and 42 minutes for quarterly medication reviews.
Sites with CPSs that held a SOP (76%) took an average of 83 minutes to complete an initial medication review and 48 minutes to complete a quarterly review. Sites with CPSs without a SOP (24%) took an average of 72 minutes to complete an initial medication review and 36 minutes to complete a quarterly review. Many CPSs allocate ≤ 20 hours per month on routine pharmacy functions (eg, prescription verification, dispensing activities, nonformulary medication requests) and ≤ 20 hours per month on nonpatient care activities (eg, education, medication use evaluations, training, projects), 67% and 82%, respectively.
Ninety-seven percent of CPSs actively attended weekly HBPC program interdisciplinary team (IDT) meetings, with 67% attending 1 weekly IDT meeting and 30% attending 2 to 5 weekly IDT meetings. Time spent attending IDT and roundtable discussions averaged 3.5 hours per week. Multiple programs noted growth within the 12 months preceding the survey, as 37 sites were granted approval for a total of 29.75 additional CPS FTEEs, and an additional 10 sites had a total of 9.25 FTEEs pending approval.