
Patient-Reported Outcome Measures: How Do Digital Tablets Stack Up to Paper Forms? A Randomized, Controlled Study


Patient-reported outcomes (PROs) are essential to assessing the effectiveness of care, and many general-health and disease-specific PROs have been developed. Until recently, data were collected predominantly with pen-and-paper questionnaires. Now, though, there is a potential role for electronic medical records in data collection. In this study, patients were randomly assigned to complete either tablet or paper questionnaires. They were surveyed on patient demographics, patterns of electronic device use, general-health and disease-specific PROs, and satisfaction. The primary outcome measure was survey completion rate. Secondary outcome measures were total time for completion, number of questions left unanswered on incomplete surveys, patient satisfaction, and survey preferences. The study included 483 patients (258 in tablet group, 225 in paper group), and the overall completion rate was 84.4%. There was no significant difference in PRO completion between the tablet and paper groups. Time to completion did not differ between the groups, but their satisfaction rates were similar. However, more paper group patients reported a preference for a tablet survey. Advantages of digital data collection include simple and reliable data storage, ability to improve completion rates by requiring patients to answer all questions, and development of interface adaptations to accommodate patients with handicaps. Given our data and these theoretical benefits, we recommend using tablet data collection systems for PROs.
Results
Of the 510 patients enrolled in the study, 483 completed the initial demographics questionnaire and were included in the analysis. Patients were excluded if they were unable to complete the initial demographics questionnaire because of clinic workflow (eg, immediate need to be seen by physician, need to transfer to radiology for imaging and not being able to revisit the survey). Mean age was 56 years (range, 14-93 years), and 51% of the respondents were female. Fifty percent owned tablets, 70% owned smartphones, and mean (SD) self-rating of computer skills was 3.13 (1.16) (Likert scale, 1-5). There were no significant demographic differences between the tablet and paper groups (Table 1). 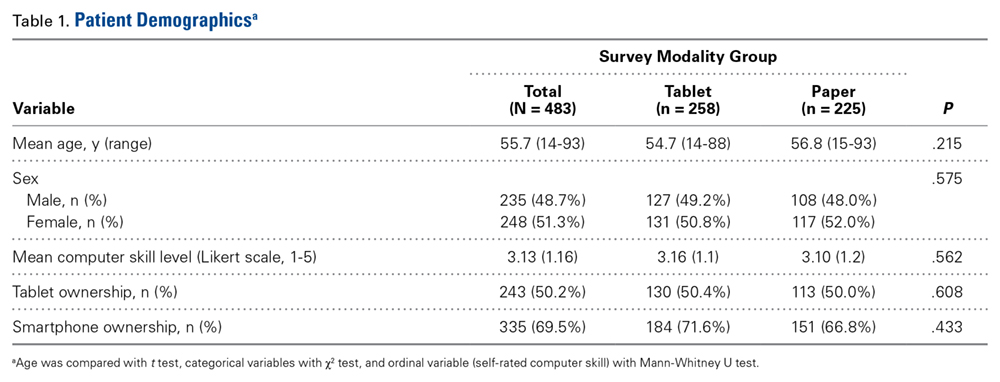
For each disease-specific questionnaire, the instrument’s published instructions for calculating scores were followed; these scores were then compared in order to further characterize the groups. There were significant differences in scores on the EQ-5D descriptive questions, a pain visual analog scale (VAS), and the NDI. Mean EQ-5D score was 0.664 for the tablet group and 0.699 for the paper group (P = .041), mean pain VAS score was 62.5 for the tablet group and 71.6 for the paper group (P < .001), and mean NDI score was 42.8 for the tablet group and 32.4 for the paper group (P = .033). 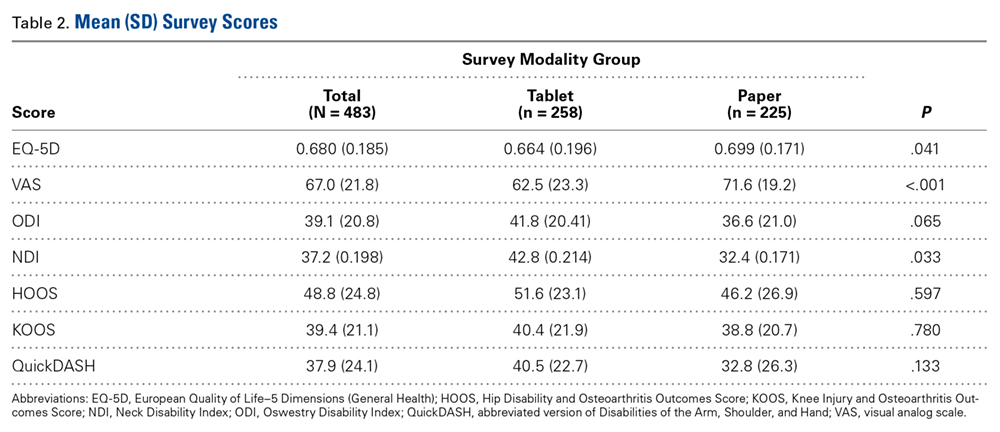
The overall completion rate for all questionnaires was 84.4%. The KOOS completion rate was 83.3% for the tablet group and 54.5% for the paper group (P = .023). Although it was not statistically significant, there was a trend toward higher rates of completing all disease-specific questionnaires in the tablet group relative to the paper group. 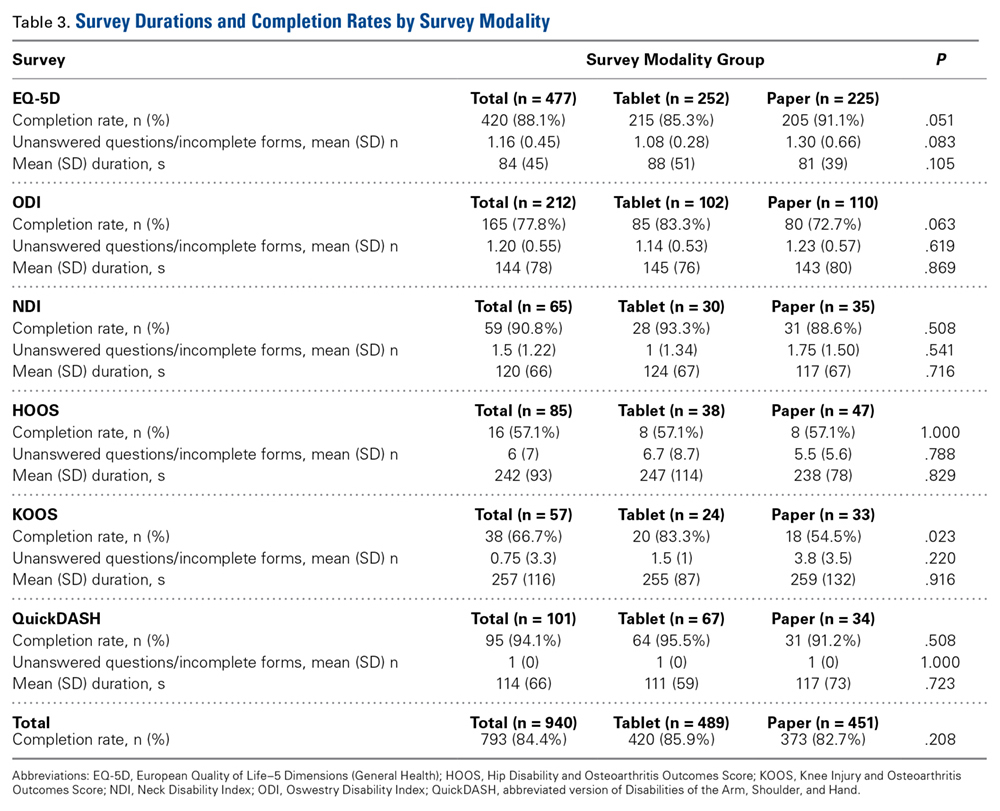
Satisfaction regarding the surveys and their modalities was similar between the groups. 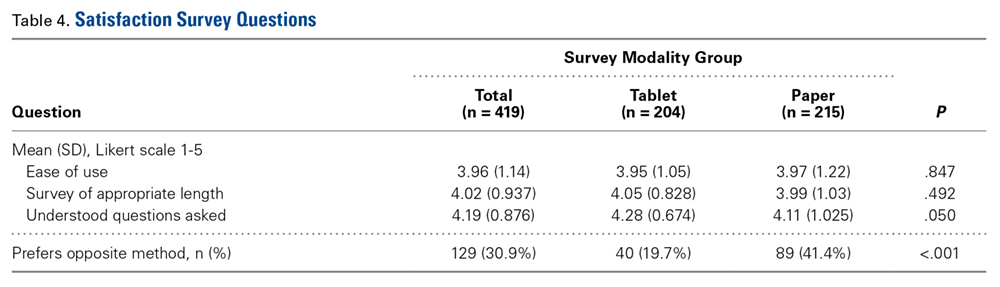
Discussion
Electronic data entry has many advantages over traditional paper-based data collection and can be used with PRO surveys to measure response to treatment. Our study evaluated whether completion rates differed between surveys administered on digital tablets and those administered on traditional paper forms in a clinic setting. We selected general-health and disease-specific instruments commonly used to collect PROs from orthopedic patients. Our primary outcome measure was survey completion rate. Secondary outcome measures were total time for completion, number of questions left unanswered on incomplete surveys, patient satisfaction, and survey preferences.
In this study, our tablet and paper groups had similar overall survey completion rates, which suggests digital tablet-based data collection is noninferior to traditional pen-and-paper data collection with respect to patient response rate in the clinical setting. It is worth emphasizing that the tablet surveys were made to resemble and function as much as possible like the paper surveys. For example, patients were allowed to select multiple answers as well as advance without answering a question. Paper surveys were mimicked so we could study inherent differences in patient responsiveness without adding digital features to prevent patients from selecting multiple answers or skipping questions. We postulate that adding these digital features could have introduced a significant difference in patient responsiveness.
Time for survey completion was not significantly different between the tablet and paper groups, demonstrating that data can be digitally collected and the aforementioned advantages realized without significant delay or clinic workflow disruption. In the future, patients may be able to complete their forms digitally, on their own devices, before arriving for their clinic visits—resulting in improved clinic workflow and data collection efficiency.
Scores computed for the health-related quality-of-life questionnaires were not significantly different between the tablet and paper groups, except for EQ-5D and NDI. Although statistically significant, the 0.035 difference between the groups’ EQ-5D scores (0.664, 0.699) is not clinically significant. (Pickard and colleagues17 established that 0.06 is the clinically significant difference between EQ-5D scores in the United States.) If there were any clinical difference in the present study, our paper group patients appeared to be in better health than our tablet group patients.
Patients’ motivation to complete surveys often plays a large role in meaningful rates of completion. On our subjective satisfaction survey, a larger percentage of patients reported they would prefer to use a tablet for future surveys (Table 4). This finding may be driven by the novelty or ease of using a popular device. Nevertheless, we think it is worthwhile to heed patient preferences, as they may point to more successful data collection and compliance.
Several other studies have compared electronic and paper data capture.6,7,9-14,18-22 Dy and colleagues6 reported on administering the DASH survey on an iPad tablet using REDCap in an outpatient setting. They found that the percentage of surveys that could be scored (<3 questions left unanswered) was significantly higher for their tablet group (98%) than their paper group (76%). The larger difference in survey completion rates in their study (vs ours) may be attributable to their use of DASH, which has more survey items (compared with QuickDASH, the instrument we used) and thus may be more sensitive to detecting differences, at the risk of increasing the burden on survey takers.23 Aktas and colleagues7 conducted a similar but smaller study of completion rates, completion times, and overall practicality of using digital tablets to collect PROs in a palliative care clinic (they did not compare tablet and paper modalities). Marsh and colleagues,12 who studied the agreement between data collected on electronic and paper versions of the WOMAC (Western Ontario and McMaster Universities) Osteoarthritis Index and the SF-12 (12-item Short Form Health Survey, Version 2) after total hip and total knee arthroplasty, found a high intraclass correlation coefficient between the 2 methods. Griffiths-Jones and colleagues11 also found a high degree of agreement between patient data collected on digital and paper surveys. In a similar study, Fanning and McAuley10 compared digital tablet and paper survey administration in an older population and found a higher percentage of preference for tablets, with ease of use and anxiety during survey completion correlating with preference. These findings mirror ours, even with our inclusion of patients in a broader age range.
Strengths of our study included its overall cohort size and the variety of measurement instruments used. In addition, we measured time for survey completion to assess the practicality of tablet-based data collection and refrained from using digital features that could have artificially improved the completion rate for this survey modality.
Our study had a few limitations. First, we recruited unequal numbers of patients from the different subspecialties—a result of each subspecialty having a different number of attending physicians and a different patient volume. Given randomization and use of similar patients across the study arms, however, this likely did not present any significant bias. Second, each patient completed a tablet survey or a paper survey but not both, and therefore we could not compare a patient’s performance on the 2 modalities. However, the burden of completing the same survey more than once likely would have lowered our participation rate and introduced additional biases we wanted to avoid. Third, despite our attempt to mimic the look of a paper survey, the tablet’s user interface presented several potential difficulties. For example, its small text and small answer buttons may have been limiting for patients with poor vision. These design features emphasize the importance of having a user interface that can be adapted to the individual, regardless of handicap. Indeed, adaptability is a potential strength of digital interfaces. For adaptability, an interface designer can use large, scalable text and add audio prompts and other features.
Our findings can be useful in evaluating patient responsiveness to surveys administered on digital tablets in an outpatient clinic setting. In this prospective, randomized study, we found that, for survey completion, use of a tablet device did not require more time than use of a paper form. In addition, the administration modalities had similar completion and error rates for a variety of orthopedic outcomes surveys. We did not activate digital features that would have given unfair advantage to the digital data collection modality. We also found a strong preference for use of technology in PRO data collection, and this may help improve collection rates. Last, though optimizing the flow of patients in our clinic was not a strict research metric, we prioritized making sure patients were not spending any more time completing these surveys than in the past. Given the potential benefits of digital surveys—immediate and accurate transfer of collected data into multiple databases, including the patient’s electronic medical record—our experience supports continuing validation of these instruments for potential wider use.
Am J Orthop. 2016;45(7):E451-E457. Copyright Frontline Medical Communications Inc. 2016. All rights reserved.


