
Leg-Length Discrepancy After Total Hip Arthroplasty: Comparison of Robot-Assisted Posterior, Fluoroscopy-Guided Anterior, and Conventional Posterior Approaches


Total hip arthroplasty (THA) effectively provides adequate pain relief and good long-term outcomes in patients with hip osteoarthritis. However, leg-length discrepancy (LLD) remains the most common cause of patient dissatisfaction and malpractice litigation in hip arthroplasty.
We conducted a study to compare LLD in patients who underwent THA performed with a robot-assisted posterior approach (RTHA), a fluoroscopy-guided anterior approach (ATHA), or a conventional posterior approach (PTHA). We reviewed all RTHA, ATHA, and PTHA cases performed by Dr. Domb between September 2008 and December 2012. Patients included in the study had a primary diagnosis of hip osteoarthritis and proper postoperative anteroposterior pelvis radiographs available. Two blinded observers calibrated and measured all radiographs twice.
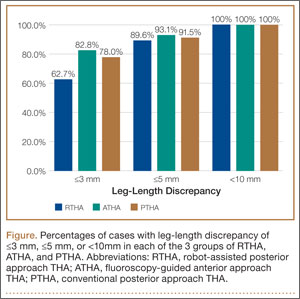
After exclusions, 67 RTHA, 29 ATHA, and 59 PTHA cases remained in the study. There were strong interobserver and intraobserver correlations for all LLD measurements (r > 0.9; P < .001). Mean (SD) LLD was 2.7 (1.8) mm (95% CI, 2.3-3.2) in the RTHA group, 1.8 (1.6) mm (95% CI, 1.2-2.4) in the ATHA group, and 1.9 (1.6) mm (95% CI, 1.5-2.4) in the PTHA group (P = .01). When LLD of more than 3 mm was set as an outlier, percentage of outliers was 37.3% (RTHA), 17.2% (ATHA), and 22% (PTHA) (P = .06-.78). When LLD of more than 5 mm was set as an outlier, percentage of outliers was 10.4% (RTHA), 6.9% (ATHA), and 8.5% (PTHA) (P = .72 to >.99). No patient in any group had LLD of 10 mm or more.
RTHA, ATHA, and PTHA did not differ in obtaining minimal LLD. All 3 techniques are effective in achieving accuracy in LLD.
To eliminate bias and increase measurement accuracy, the study had each of 2 observers collect the LLD data twice, 2 months apart. These observers were blinded to each other’s results and to the type of surgery performed. (Neither observer was Dr. Domb, the senior surgeon.) IBM SPSS Statistics software (Version 20; IBM, Armonk, New York) was used for statistical analysis. Each patient’s 4 measurements were averaged into a single number for LLD, and the absolute LLD values were used in all statistical analyses. Means, standard deviations (SDs), and 95% confidence intervals (CIs) were calculated for LLD in each of the 3 groups. Pearson correlation coefficient was used to determine interobserver and intraobserver reliability. One-way analysis of variance (ANOVA) was used to compare group means for age, body mass index (BMI), and LLD. In each group, number of outliers was determined with outliers set at LLDs of more than 3 mm and more than 5 mm. Fischer exact test was used to compare number of outliers in each group. P < .05 was considered statistically significant.
Results
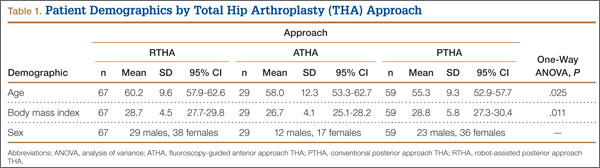
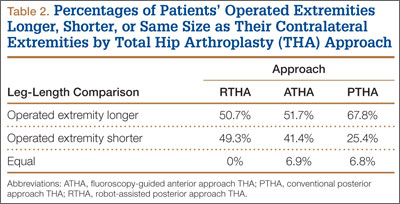
Table 1 lists the demographic data, including age, sex, and BMI, and compares the means. There were strong interobserver and intraobserver correlations for all LLD measurements (r > 0.9; P < .001). Mean (SD) LLD was 2.7 (1.8) mm (95% CI, 2.3-3.2) in the RTHA group, 1.8 (1.6) mm (95% CI, 1.2-2.4) in the ATHA group, and 1.9 (1.6) mm (95% CI, 1.5-2.4) in the PTHA group (P = .01). When LLD of more than 3 mm was set as an outlier, percentage of outliers was 37.3% (RTHA), 17.2% (ATHA), and 22% (PTHA) (P = .06-.78). When LLD of more than 5 mm was set as an outlier, percentage of outliers was 10.4% (RTHA), 6.9% (ATHA), and 8.5% (PTHA) (P = .72 to >.99). No patient in any group had LLD of 10 mm or more (Figure). Table 2 lists percentages of patients’ operated extremities that were longer, shorter, or the same size as their contralateral extremities. Six (9.0%) of the 67 RTHA patients, 4 (13.8%) of the 29 ATHA patients, and 3 (5.1%) of the 59 PTHA patients had a contralateral THA.
Discussion
Our study results showed that RTHA, ATHA, and PTHA were equally effective in minimizing LLD. There was a statistically significant difference in mean LLD among the 3 groups studied. The RTHA group had the largest mean (SD) LLD: 2.7 (1.8) mm. However, statistically significant differences do not always indicate clinical significance.27 Therefore, comparison of the 3 groups’ means is not enough for drawing significant conclusions. The more important point to consider is the number of cases of LLD of 10 mm or more—a discrepancy that would be perceptible to patients and thus become a source of dissatisfaction with painless THA.28 Patients perceive LLD when shortening exceeds 10 mm and lengthening exceeds 6 mm,29 or when LLD is more than 10 mm.16,19,20 Despite significant differences in means, all our cases came in under the 10-mm threshold. When the threshold was decreased to 5 mm (and to 3 mm), there was no statistically significant difference among the groups in the number of cases above the threshold.
LLD remains a source of significant post-THA comorbidity and patient dissatisfaction.1-7,19 Despite surgeons’ efforts to minimize LLD, some patients can detect even a subtle LLD after surgery.1,8,29 Most LLD values reported in the literature fall under the 10-mm threshold.16,19,20 In some cases, however, postoperative LLD is more than 1 cm, enough to prompt litigation against orthopedic surgeons.2 Surgeons have tried to improve LLD with use of multiple techniques, including use of intraoperative measuring devices,30 patient positioning during surgery,20 use of computer-assisted surgery,19 and use of intraoperative fluoroscopy.20
Proponents of computer-assisted THA have argued that this technique improves accuracy in placing the acetabular cup in the safe zone,31 minimizes LLD, and restores femoral offset.32,33 Manzotti and colleagues16 reported on 48 cases of computer-assisted THA matched to 48 cases of conventional THA using the posterior approach. Mean (SD) LLD was 5.06 (2.99) mm in the computer-assisted group and 7.64 (4.36) mm in the conventional group; there was a statistically significant difference in favor of the computer-assisted group (P = .04). However, 5 patients in the computer-assisted group and 13 in the conventional group had LLD of more than 10 mm, and the difference was statistically significant.16 Moreover, the study population was heterogeneous, with 12 patients in both groups having developmental dysplasia as a primary diagnosis.16 All the cases in our study had a diagnosis of OA, and no case had LLD of 10 mm or more.


