Assessment of Scapular Morphology and Surgical Technique as Predictors of Notching in Reverse Shoulder Arthroplasty


There has been increased focus on understanding risk factors for scapular notching in reverse shoulder arthroplasty (RSA). We conducted a study to evaluate the scapular notching index and other factors associated with the occurrence of scapular notching.
Ninety-one patients treated with primary RSA were followed for a minimum of 24 months. Patients’ radiographic assessments were grouped by Nerot grade of scapular notching (group 1, grades 0 and 1; group 2, grades 2, 3, 4). Group mean differences were compared for preoperative scapular neck angle (SNA), prosthesis–scapular neck angle (PSNA), peg glenoid rim distance (PGRD), notching index, and clinical outcomes.
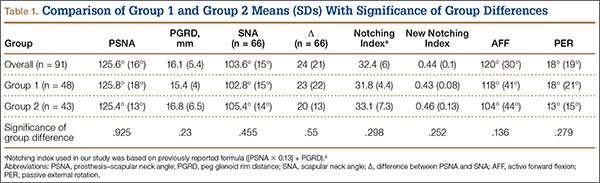
There was no significant difference in mean (SD) notching index between group 1, 31.8 (4.4), and group 2, 33.1 (7.3), and there were no significant differences in SNA (102.8° vs 105.4°; P = .3), PSNA (125.8° vs 125.4°; P = .82), PGRD (15.4 vs 16.8 mm; P = .47), or clinical outcomes between the groups.
Our results suggest that Grammont-style prostheses have a higher rate of notching regardless of optimal PGRD and variations in PSNA. Perhaps with certain scapular morphology, prosthetic design may be a more significant contributor to notching.
Preoperative and postoperative anteroposterior radiographs were evaluated by 2 independent observers (attending surgeon, junior resident). Per standard technique, each radiograph was positioned horizontal to the scapular plane. Of the 91 patients, 66 had preoperative shoulder radiographs of acceptable quality, with complete visualization of scapular morphology. Radiographs were reviewed to measure the scapular neck angle (SNA), inferior scapular notching, prosthesis–scapular neck angle (PSNA), and peg glenoid rim distance (PGRD) (Figure 1). For the 66 patients with acceptable preoperative radiographs, SNA was determined by subtracting preoperative SNA from postoperative PSNA. Postoperative anteroposterior radiographs were used to classify degree of inferior scapular notching based on the Nerot grading scale (0-4). In addition, glenosphere overhang and glenosphere inclination were measured on postoperative radiographs.

The 91 shoulders were sorted into 2 groups based on degree of scapular notching: group 1, Nerot grade 0 (no inferior notching) and grade 1, and group 2, Nerot grades 2, 3, and 4. Group 1 had 37 patients with a size 36 glenosphere, 3 patients with size 38, and 8 patients with size 42; group 2 had 34 patients with a size 36 glenosphere, 1 patient with size 38, and 8 patients with size 42. All measurements were normalized to account for differences in glenosphere size. Groups 1 and 2 were compared on each radiographic parameter (inferior scapular notching, PSNA, PGRD, SNA).
Notching indexes were calculated ([PSNA × 0.13] + PGRD) and compared with the suggested index of 35.8 Simovitch and colleagues8 demonstrated that a notching index of more than 35 had 91% sensitivity and 88% specificity in predicting inferior notching, whereas a notching index of 35 or less avoided inferior notching 91% of the time. In this study, notching index was calculated for each patient, and then the mean values of groups 1 and 2 were compared (Table 1).
The effect of scapular notching and other individual radiographic parameters on outcomes was also evaluated with respect to forward flexion, external rotation, VAS pain score, complications, and external rotation lag sign. Mann-Whitney U test was used to test these variables; Spearman rank test was performed to determine correlation between each variable and scapular notching; logistic regression was used to explore the relationship of variables (PGRD, PSNA) as predictors of Nerot degree of inferior scapular notching, and postoperative complications; and independent-samples t test was used to determine group differences for each variable. For each investigation, the level of significance was set at P < .05. A biostatistician performed all statistical analyses using SPSS Version 19 (IBM, Armonk, New York).
Results
Our study cohort consisted of 91 shoulders. Mean follow-up was 41.8 months (range, 24.0-80.8 months). Seventy-five (82%) of the 91 shoulders developed scapular notching. Mean (SD) SNA on preoperative radiographs, used to assess preoperative scapular morphology, was 103.9° (14.5°). For all 91 shoulders, mean (SD) PSNA was 125.6° (16°), and mean (SD) PGRD was 16 (5.4) mm (Table 1). Inclination measurements were available for 86 patients. Mean (SD) inclination from 90° was 2.5° (10.3°) (range, 21°-30°). Mean (SD) SNA (postoperative PSNA minus preoperative SNA) for the 66 patients with acceptable preoperative radiographs was 24.3° (21.3°) (Table 1). Forty-eight of the 91 shoulders were placed in scapular notching group 1 (16 grade-0 shoulders, 32 grade-1 shoulders); the other 43 shoulders were placed in group 2 (33 grade-2 shoulders, 9 grade-3 shoulders, 1 grade-4 shoulder). Mean follow-up was 40 months for group 1 and 43 months for group 2.
There were no significant differences between groups 1 and 2 in SNA (102.8° vs 105.4°; P = .3), PGRD (15.4 vs 16.8 mm; P = . 47), or PSNA (125.8° vs 125.4°; P = .82) (Table 1). In addition, groups 1 and 2 had no significant differences (P > .05) in glenoid overhang and glenosphere inclination (other possible factors influencing notching).
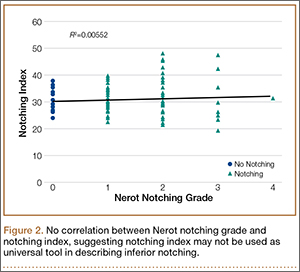
Mean (SD) notching index was 31.8 (4.4) for group 1 and 33.1 (7.2) for group 2. These values were not significantly different (P = .29) (Table 1, Figure 2).8 Each was below the recommended threshold of 35 for prevention of notching (Table 1, Figure 2).
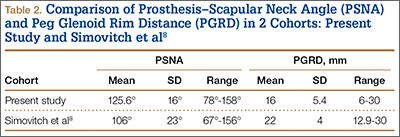
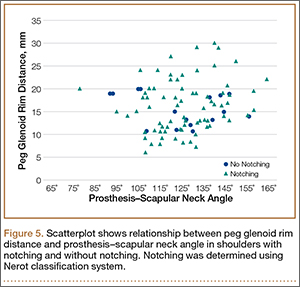
To try to understand why mean scapular notching index was low for both groups, we examined the contributing factors individually. Our cohort’s mean PGRD of 16.1 mm (15.4 and 16.8 mm for groups 1 and 2, respectively) was significantly lower than the cohort mean reported by Simovitch and colleagues8 (Table 2). Given that PGRD is more strongly weighted in the originally described notching index ([PSNA × 0.13] + PGRD),8 it was the primary driver for our notching index results, even though on average our results demonstrated a PSNA higher than that found by Simovitch and colleagues8 (Table 2; Figures 3, 4). Analyzing PGRD and PSNA together, we found no relationship between these variables and increased severity of inferior notching (Figure 5).