ST-segment elevation: Differential diagnosis, caveats
ABSTRACTThe differential diagnosis of ST-segment elevation includes four major processes: ST-segment elevation myocardial infarction (STEMI); early repolarization; pericarditis; and ST elevation secondary to an abnormality of the QRS complex (left bundle branch block, left ventricular hypertrophy, or preexcitation). Other processes that may be associated with ST elevation include hyperkalemia, pulmonary embolism, and Brugada syndrome. The clinical setting and specific electrocardiographic criteria often allow identification of the cause. This article reviews ST-T and QRS configurations specific to each diagnosis.
KEY POINTS
- Features of STEMI: (1) ST elevation that is straight or convex upward and blends with T to form a dome; (2) wide upright T or inverted T waves; (3) Q waves; (4) ST elevation or T waves that may approximate or exceed QRS height; and (5) reciprocal ST depression.
- Features of early repolarization include a notched J point and ST elevation not exceeding 3 mm.
- Features of pericarditis include PR depression greater than 1 mm and ST elevation less than 5 mm.
- Features of left bundle branch block, left ventricular hypertrophy, and preexcitation: both ST and T are discordant to QRS; ST elevation is less than 25% of QRS height (and less than 2.5 mm in left ventricular hypertrophy); and delta waves, short PR, and pseudo-Q waves are seen in preexcitation.
- Features of hyperkalemia include narrow-based, peaked T waves “pulling” the ST segment.
LEFT VENTRICULAR HYPERTROPHY
In left ventricular hypertrophy, a deep S wave is seen in leads V1 to V3, with ST elevation and T waves that are discordant with the QRS complex. Rarely, ST elevation may be straight or convex. The following findings imply MI:
- ST elevation or depression that is concordant with the QRS.
- Inverted T waves that are concordant with the QRS in more than one lead, or biphasic T waves in more than one lead (eg, V1 to V3).
- A discordant ST segment or a T wave that is very large may imply ischemia. In left ventricular hypertrophy, ST elevation is usually less than 2.5 mm in leads V1 to V3 and is rarely seen in the inferior leads, where it would be less than 1 mm.34 When ST elevation is seen in leads V1 to V3 in left ventricular hypertrophy, an ST magnitude of 25% or more of the total QRS voltage has a 91% specificity for STEMI.34
On another note, right ventricular hypertrophy and right bundle branch block may lead to ST-segment depression and T-wave inversion, but not to ST elevation. Thus, ST elevation occurring with right ventricular hypertrophy or right bundle branch block implies STEMI. While only left bundle branch block poses a diagnostic challenge, both types of bundle branch block, if secondary to STEMI, represent equally high-risk categories.38
,PREEXCITATION
HYPERKALEMIA
OTHER CAUSES OF ST-SEGMENT ELEVATION
Takotsubo cardiomyopathy
Takotsubo cardiomyopathy mimics all electrocardiographic features of anteroapical STEMI. ST elevation may extend to the inferior leads but cannot be isolated in the inferior leads.39 As in apical STEMI, reciprocal ST depression is uncommon. Within 24 to 48 hours, ST elevation evolves into deep anterior T-wave inversion and a prolonged QT interval. Transient Q waves may be seen.
Myocarditis
Myocarditis may have one of two electrocardiographic patterns: a pericarditis pattern, or a typical STEMI pattern with Q waves sometimes localized to one area.40
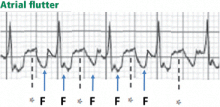
Atrial flutter waves
Large pulmonary embolism
A large pulmonary embolism may be associated with T-wave inversion in the anterior leads or the inferior leads, or both, reflective of cor pulmonale. Less commonly, ST elevation in the anterior or inferior leads is seen. In fact, changes of both anterior and inferior ischemia should always suggest a pulmonary embolism.41,42
Brugada syndrome
Hyperkalemia, Brugada syndrome, and sometimes pulmonary embolism are characterized by an ST elevation that slopes downward (Figures 11 and 13), which contrasts with the upsloping, convex ST elevation of STEMI.


