ST-segment depression and T-wave inversion: Classification, differential diagnosis, and caveats


ABSTRACTHeightened awareness of the characteristic patterns of ST-segment depression and T-wave inversion is paramount to quickly identifying life-threatening disorders. This paper reviews how to distinguish the various causes of these abnormalities.
KEY POINTS
- ST-T abnormalities concordant to the QRS complex suggest ischemia.
- Deep T-wave inversion or positive-negative biphasic T waves in the anterior precordial leads reflect severe left anterior descending coronary artery stenosis.
- Two particular patterns of ST-segment depression reflect ST-segment elevation myocardial infarction rather than non–ST-segment elevation acute coronary syndrome: ST-segment depression that is reciprocal to a subtle and sometimes overlooked ST-segment elevation, and ST-segment depression that is maximal in leads V1–V3, suggesting true posterior infarction.
- T-wave inversion in the anterior precordial leads may be seen in cases of acute pulmonary embolism, while flattened T waves with prominent U waves and ST-segment depression may reflect hypokalemia or digitalis therapy.
ISCHEMIC ST-SEGMENT DEPRESSION, T-WAVE INVERSION, OR BOTH
ST-segment depression or T-wave inversion is consistent with ischemia if any of the following is true:
- The ST-segment depression or T-wave inversion is directed in the same direction as the QRS complex: this is called concordance between the QRS complex and the ST or T abnormality (Figure 1B).
- The ST segment is depressed but the T wave is upright (Figure 1C).
- The T wave has a positive-negative biphasic pattern (Figure 1D).
- The T wave is symmetrically inverted and has a pointed configuration, while the ST segment is not deviated or is upwardly bowed (coved) or horizontally depressed (Figure 1E).
- The magnitude of ST-segment depression progresses or regresses on serial tracings, or ST-segment depression progresses to T-wave abnormality during ischemia-free intervals (dynamic ST-segment depression).
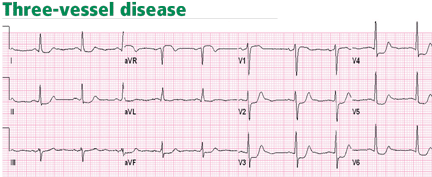
Unlike ST-segment elevation, ST-segment depression does not localize ischemia.6 However, the extent and the magnitude of ST-segment depression correlate with the extent and the severity of ischemia. In fact, ST-segment depression in eight or more leads, combined with ST-segment elevation in leads aVR and V1 and occurring during ischemic pain, is associated with a 75% predictive accuracy for left main coronary artery or three-vessel disease (Figure 3).7,8 This finding may also be seen in cases of tight proximal stenosis of the left anterior descending coronary artery.9
,Wellens syndrome
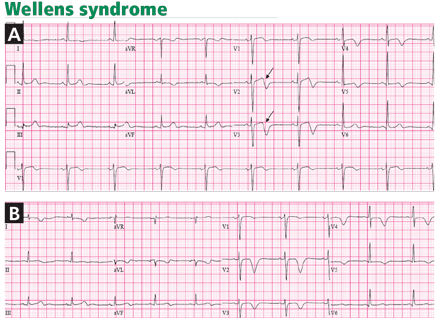
Wellens and his colleagues showed that 75% of patients who developed these T-wave abnormalities and who were treated medically without angiographic investigation went on to develop extensive anterior wall myocardial infarction within a mean of 8.5 days.10
In a later investigation of 1,260 patients presenting with unstable angina, 180 patients (14%) had this characteristic T-wave pattern.11 All of the latter patients had stenosis of 50% or more in the proximal left anterior descending artery, and 18% had total occlusion of the left anterior descending artery.
Thus, although medical management may provide symptomatic improvement at first, early coronary angiography and revascularization should be strongly considered in anyone with Wellens syndrome because it usually predicts impending anterior myocardial infarction.
Wellens syndrome is characterized by two patterns of T-wave changes. In 75% of cases, T waves are deeply (≥ 5 mm) and symmetrically inverted in leads V2 through V4 (Figures 1E, 4B). In 25% of cases, the T wave has a characteristic positive-negative biphasic morphology in leads V2 through V4 (Figures 1D, 4A).10 In both patterns, the ST segment is isoelectric or minimally elevated (< 1 mm) with a straight or convex morphology, the down-slope of the T wave is sharp, and the QT interval is often prolonged. These abnormalities are characteristically seen hours to days after the ischemic chest pain resolves. In fact, the ischemic episode is usually associated with transient ST-segment elevation or depression that progresses to the T-wave abnormality after the pain subsides.11
In Wellens’ original description, only 12% of patients had increases in their creatine kinase levels, and these were small. Therefore, the electrocardiogram may be the only indication of an impending large anterior infarction in a chest-pain-free patient.12
T waves that are symmetrically but less deeply inverted than Wellens-type T waves may still represent ischemia. However, this finding is less specific for ischemia and is associated with better outcomes than Wellens syndrome or ST-segment deviation, particularly when the T wave is less than 3 mm deep.14 In fact, one prospective cohort study found that isolated mild T-wave inversion in patients presenting with acute coronary syndrome is associated with a favorable long-term outcome, similar to that in patients with no electrocardiographic changes.15
FREQUENTLY MISSED DIAGNOSES MANIFESTING AS ST-SEGMENT DEPRESSION OR T-WAVE INVERSION
True posterior ST-segment elevation myocardial infarction
When accompanied by inferior STEMI, posterior infarction is easily recognized, but it can be difficult to diagnose when it occurs alone, the so-called true posterior STEMI.
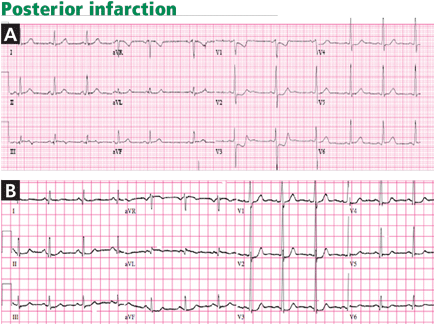
In most cases of posterior infarction, the posterior chest leads V7, V8, and V9 reveal ST-segment elevation.19 One study found that ST-segment depression in the anterior precordial leads was as sensitive as ST-segment elevation in leads V7 through V9 in identifying posterior myocardial infarction (sensitivity 80%),20 while other studies found that ST-segment deviation on standard 12-lead electrocardiography has a lower sensitivity (about 60%) in identifying posterior infarction.18,21
Tall or wide (≥ 0.04-s) R waves in leads V1 or V2, particularly when associated with upright T waves, suggest posterior infarction and may further corroborate this diagnosis, but this finding may take up to 24 hours to manifest and is seen in only about 50% of patients with posterior infarction.21
Studies have shown that ST-segment elevation on standard 12-lead electrocardiography is found in fewer than 50% of patients with acute left circumflex occlusion and inferoposterior infarction,18 yet these are cases of “missed” STEMI that indeed benefit from emergency angiography and reperfusion. In addition, studies of non–ST-segment elevation acute coronary syndrome consistently identify patients who have epicardial vessel occlusion (about 15%–20% of cases),18 yet their initial angiography is usually delayed for hours or days after the initial presentation.
A subgroup analysis from TRITON–TIMI 38 (Trial to Assess Improvement in Therapeutic Outcomes by Optimizing Platelet Inhibition With Prasugrel Thrombolysis in Myocardial Infarction 38) evaluated patients with isolated anterior ST-segment depression. An occluded “culprit” artery was found 26% of the time, most often the left circumflex artery. Moreover, those patients had a significantly higher rate of death or myocardial infarction at 30-day follow-up than patients without a culprit artery, probably related to delayed revascularization.22
Recognizing that ST-segment depression that is greatest in leads V1, V2, or V3 represents posterior infarction helps identify a portion of the missed STEMIs in a timely fashion. In addition, in cases of anterior ST-segment depression and in cases of chest pain with nondiagnostic electrocardiography, the recording of ST elevation in leads V7, V8, and V9 is highly sensitive for detecting a true posterior injury.