Basics of study design: Practical considerations


Estimating sample size and power analysis
One very important consideration in any study is the required number of study subjects for meaningful statistical conclusions. In other words, how big should the sample size be? Sample size is important because it affects the feasibility of the study and the reliability of the conclusions in terms of statistical power. The necessary sample size depends on 2 basic factors. One factor is the variability of the data (often expressed as the standard deviation). The other factor is the effect size, meaning, for example, how big of a difference between mean values you want to detect. In general, the bigger the variability and the smaller the difference, the bigger the sample size required.
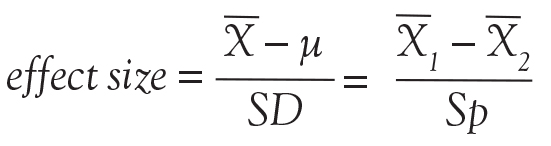
As the above equation shows, the effect size is expressed, in general, as a mean difference divided by a standard deviation. In the first case, the numerator represents the difference between the sample mean and the assumed population mean. In the denominator, SD is the standard deviation of the sample (used to estimate the standard deviation of the population). In the second case, the numerator represents the difference between the mean values of 2 samples and the denominator is the pooled standard deviation of the 2 samples.
In order to understand the issues involved with selecting sample size, we need to first understand the types of errors that can be made in any type of decision. Suppose our research goal is to make a decision about whether a new treatment results in a clinical difference (improvement). The results of our statistical test are dichotomous—we decide either yes there is a significant difference or no there isn’t. The truth, which we may never know, is that in reality, the difference exists or it doesn’t.

As Figure 7 shows, the result of our decision making is that there are 2 ways to be right and 2 ways to be wrong. If we decide there is a difference (eg, our statistical tests yields P ≤ .05) but in realty there is not a difference, then we make what is called a type I error. On the other hand, if we conclude that there is not a difference (ie, our statistical test yields P > .05) but in reality there is a difference that we did not detect, then we have made a type II error.

The associated math is shown in Figure 8. The probability of making a type I error is called alpha. By convention in medicine, we set our rejection criterion to alpha = 0.05. In other words, we would reject the null hypothesis (that there is no difference) anytime our statistical test yields a P value less than alpha. The probability of making a type II error is called beta. For historical reasons, the probability of not making a type II error is called the statistical power of the test and is equal to 1 minus beta. Power is affected by sample size: the larger the sample the larger the power. Most researchers, by convention, keep the sample size large enough to keep power above 0.80.

Figure 9 is a nomogram that brings all these ideas together. The red line shows that for your study, given the desired effect size (0.8), if you collected samples from the 30 patients you planned on then the power would be unacceptable at 0.60, indicating a high probability of a false negative decision if the P value comes out greater than .50. The solution is to increase the sample size to about 50 (or more), as indicated by the blue line. From this nomogram we can generalize to say that when you want to detect a small effect with data that have high variability, you need a large sample size to provide acceptable power.
The text below is an example of a power analysis presented in the methods section of a published study.20 Note that the authors give their reasoning for the sample size they selected. This kind of explanation may inform your study design. But what if you don’t know the variability of the data you want to collect? In that case, you need to collect some pilot data and calculate from that an appropriate sample size for a subsequent study.
A prospective power calculation indicated that a sample size of 25 per group was required to achieve 80% power based on an effect size of probability of 0.24 that an observation in the PRVCa group is less than an observation in the ASV group using the Mann-Whitney tests, an alpha of 0.05 (two-tailed) and a 20% dropout.
JUDGING FEASIBILITY
Once you have a draft of your study design, including the estimated sample size, it is time to judge the overall feasibility of the study before committing to it.

Every study has associated costs. Those costs and the sources of funding must be identified. Don’t forget costs for consultants, particularly if you need statistical consultation.
Finally, consider your level of experience. If you are contemplating your first study, a human clinical trial might not be the best choice, given the complexity of such a project. Studies such as a meta-analysis or mathematical simulation require special training beyond basic research procedures, and should be avoided.