
Differences in Prognostic Value of FLT3 and NPM1 Mutations in Patients With Acute Myeloid Leukemia


Background: The prognostic value of nucleophosmin-1 (NPM1) and fms-like tyrosine kinase 3 (FLT3) mutations has been established in adults, but is less clear in patients aged ≥ 65 years. This retrospective cohort study sought to assess adult patients with acute myeloid leukemia (AML who received FLT3) and/or NPM1 testing at any Veterans Health Administration facility or at Vanderbilt University Medical Center between January 2006 and December 2016.
Methods: The primary analysis compared time with all-cause death among patients with AML based on FLT3 and NPM1 mutation status, age (< 65 years vs ≥ 65 years), and cytogenetic risk group (unfavorable, intermediate/normal, favorable).
Results: The study included 766 patients with a mean (SD) age of 59.7 (16.6) years (46.0% aged ≥ 65 years). Patients had a mutation rate of 19.8% for FLT3 and 22.1% for NPM1. Age was a significant factor in overall survival (OS) when comparing patients aged < 65 vs ≥ 65 years: median OS was 24.3 months vs 8.2 months, respectively (P < .001). Cytogenetic risk status also was a significant factor when comparing median OS for patients aged < 65 vs ≥ 65 years: favorable group not reached, intermediate/ normal 17.6 months vs unfavorable 6.8 months, respectively (P < .001). The most favorable prognostic group (FLT3-/NPM1+) among older patients showed worse OS (15.2 months) compared with the poor prognostic group (NPM1-/FLT3-) among younger patients (18.4 months). In the older cohort, FLT3 and NPM1 mutation status, favorable karyotype, and Charlson Comorbidity Index (CCI) were not identified as prognostic factors. In the full cohort, we used Cox proportional hazard regression, least absolute shrinkage, and selection operator analyses to examine age, FLT3 and NPM1 mutation status, cytogenetic risk group, treatment site, race, primary payor, and CCI. Older age (65 years vs 35 years) was the strongest risk factor in AML (hazard ratio, 2.44; 95% CI, 1.61-3.68; P < .001).
Conclusions: Although there are well-defined molecular and cytogenetic prognostic factors in AML, age ≥ 65 years has a stronger association with outcome.
Acute myeloid leukemia (AML) is an aggressive hematologic malignancy that, when left untreated, rapidly leads to death. More than 20,000 new cases of AML are diagnosed annually in the United States, with incidence rates of AML increasing with age from < 2 per 100,000 in patients aged < 65 years to > 16 per 100,000 in patients aged ≥ 65 years.1,2 More than 57% of newly diagnosed AML occurs in patients aged > 65 years, with more than one-third of new cases in patients aged > 75 years.3 In addition to higher incidence rates, patients aged > 65 years also have worse outcomes and lower 5-year survival rates—7% compared with about 45% in those aged < 65 years.3 While age is an important independent prognostic risk factor for survival and response to treatment, the low 5-year survival rates for patients aged > 65 years is influenced by numerous other factors: decreased performance status, increased rates of unfavorable cytogenetic and molecular risk factors, and reduced usage of intensive chemotherapy and bone marrow transplant.4-12
Cytogenetic and molecular risk factors are important prognostic factors for survival and factor into decisions on postremission therapy.13 Cytogenetics stratifies patients into high-, intermediate-, and low-risk populations, and unfavorable cytogenetics is a predictor of poor outcomes across all age groups.9,13-15 Normal karyotype is classified within the intermediate-risk category and accounts for about 40% of the population; the heterogeneous nature of this group has led to further stratification based on molecular abnormalities in fms-like tyrosine kinase 3 (FLT3) and nucleophosmin 1 (NPM1).10
FLT3-internal tandem domain (ITD) and NPM1 are common molecular biomarkers occurring in about 21% and 36% of patients with AML, respectively.16,17 NPM1 and FLT3 (ITD and tyrosine kinase domain [TKD]) mutations are all more frequent in patients with normal karyotype and de novo AML, with FLT3 mutations twice as common in patients with the NPM1 mutation than in patients with NPM1 wild type.18-24 NPM1 mutations are considered a favorable prognostic factor associated with increased rates of complete remission and superior overall survival (OS) and disease-free survival (DFS), at least in the absence of co-occurring FLT3-ITD mutations.25-28 In contrast, FLT3-ITD mutations are considered a poor prognostic factor with decreased OS and DFS, though co-occurrence with NPM1 mutations improves outcomes over FLT3-ITD alone.16,22,23,29 The effects of FLT3-TKD mutations have been mixed; studies have found decreased OS and DFS with TKD mutation alone or in combination with ITD,16,22,30,31 but paradoxically improved OS when in combination with NPM1 mutations compared with the presence of the NPM1 mutation alone.24,29-31
While established in younger patients, the prognostic significance of NPM1 and FLT3- ITD within older patients is less clear, although recent studies have examined this within various AML study groups and registries.32,33 This study uses a large real-world cohort of adult patients with AML treated at either a Veterans Health Administration (VHA) facility or the Vanderbilt University Medical Center (VUMC) to investigate the prognostic implications of NPM1 and FLT3-ITD mutations in patients aged ≥ 65 years compared with patients aged < 65 years.
Methods
The study population consisted of patients diagnosed with AML between January 1, 2006, and December 31, 2016, who sought care at VUMC or any VHA facility. Patients met the following inclusion criteria: (1) aged ≥ 18 years; (2) newly diagnosed or initially treated at the respective institution and documented in the cancer registry; and (3) received FLT3 and/or NPM1 testing.
Identification of Tests
Within this cohort of patients, molecular tests for FLT3-ITD and NPM1 mutations and dates of testing were identified. Cytogenetics were classified favorable, unfavorable, and intermediate or normal, per National Comprehensive Cancer Network (NCCN) Guidelines risk categories.
At VUMC, the results and testing dates were extracted from the enterprise data warehouse. Next-generation sequencing tests were identified and results for FLT3-ITD, FLT3-TKD, and NPM1 mutations were manually abstracted from the results. We conducted further review of patient electronic health records (EHRs) for patients without testing information at diagnosis to identify any outside testing or unstructured test results.
At the VHA, structured test results and testing information were taken from the national Genetic Diagnostic Testing database. We identified additional patients with FLT3-ITD or NPM1 testing by test name and keyword searches of notes and test results within the EHRs. Test results for FLT3-ITD, FLT3-TKD, and NPM1 genomic mutations and cytogenetic results were abstracted either from test comments or manual review of EHRs.
Determination of Diagnostic Testing
We defined diagnostic molecular and cytogenetic tests as any results received within 14 days prior to the date of diagnosis or within 12 days postdiagnosis. Any patient without test results within this range or any indication that testing was conducted on a sample taken within the range underwent manual EHR review to identify possible diagnostic test results (eg, molecular testing results within 4 weeks postdiagnosis, but the laboratory report states the sample was a diagnostic sample). Test results falling outside this range were reviewed and included as diagnostic test results if ≥ 1 of the following conditions was met: (1) test was performed ≤ 30 days prior to the diagnosis; (2) test was performed within 30 days of diagnosis with residual disease, defined as > 20% blast for normal/not detected results; (3) test was performed within 60 days of diagnosis in untreated disease; or (4) test was performed within 60 days of initial diagnosis and within 30 days of completion of initial treatment with residual disease, defined as > 20% blasts for normal/not detected results.
Statistical Analysis
The primary analysis compared time with all-cause death among patients with AML who tested positive or negative for either FLT3 or NPM1 mutations. Time 0 was the date of AML diagnosis. Patients were censored at last patient contact or end of the study period (December 31, 2016). Seventy-eight patients who did not have both FLT3 and NPM1 genetic tests were excluded. Missing data were imputed using multivariate imputation by chained equations. Kaplan-Meier plots and log-rank tests were reported by age group (< 65 years, ≥ 65 years), FLT3 and NPM1 status (+/–), and cytogenetic group (unfavorable, intermediate/normal, favorable). We performed a penalized Cox proportional hazards (PH) regression, using the L1 penalty (least absolute shrinkage and selection operator [LASSO]) to select a subset of predictor variables. The tuning parameter λ, which controls the strength of the penalty, was selected based on cross-validation using the mean square error as the criterion. We selected the λ with the minimum cross-validation error. We used the variables identified by the LASSO method (eg, age at diagnosis, race, cytogenetic group, primary payor, and Charlson Comorbidity Index [CCI]) and variables identified a priori (FLT3 status, NPM1 status, and site) in an unpenalized Cox PH model.34 Restricted cubic splines with 3 to 5 knots were used for all continuous variables. Linear contrasts for age and CCI were also reported. Preplanned subgroup analyses were performed by stratifying based on age (< 65 years vs ≥ 65 years). All statistical analyses were conducted using R software version 3.5.1.
Results
A total of 766 patients with AML (439 VUMC and 327 VHA) were tested for FLT3 or NPM1. The overall population had a mean (SD) age at diagnosis of 59.7 (16.6) years and was predominantly White (84.5%) and male (74.7%). Patient coverage was split among private insurance (25.5%), Medicare (31.6%), and Tricare (32.4%). Most VHA patients were diagnosed at high complexity facilities (62.1% at 1A and 22.6% at 1B facilities). The mean (SD) distance between the patient and diagnostic medical center was 114.7 (186.3) miles, and the mean (SD) distance from the diagnostic medical center to an National Cancer Institute-designated cancer center was 26.6 (67.6) miles. Most patients had prior diagnoses of either myelodysplastic syndrome (MDS) (29.2%) or myeloproliferative neoplasm (MPN) (26.2%).
Site Differences
There were significant differences in mean age at diagnosis between the VUMC and VHA patient populations (55.8 years vs 64.9 years, respectively; P < .001), and in sex distribution (57.9% male vs 97.2% male; P < .001). The VUMC population had a slightly lower percentage of non-White patients (12.5% vs 19.6%; P = .01) and lower comorbidities as measured by the CCI (0.40 vs 1.43; P < .001). The VUMC patient population resided in areas with lower rates of college-educated individuals (21.3% vs 27.8%; P < .001) and higher rates of individuals below the poverty level threshold (17.5% vs 15.8%; P < .001). VUMC patients were much more likely than VHA patients to have a reported prior hematologic neoplasm, with MDS (42.8% vs 11.0%; P < .001) and MPN (42.6% vs 4.3%; P < .001) being the most prevalent prior conditions noted.
Age-Stratified Cohort Differences
The population was roughly evenly distributed with 414 patients aged < 65 years and 352 patients aged ≥ 65 years. The mean (SD) age of the younger cohort was 49.3 (15.6) years and 72.0 (5.8) years in the older cohort. We observed differences in sex distribution between the age-stratified cohorts (younger: 68.4% male vs older: 82.1% male). There were no significant differences in racial distribution between the cohorts. Younger patients had fewer comorbidities as measured by CCI (younger: 0.6 vs older: 1.1; P < .001). The older cohort resided in areas with higher rates of college-educated individuals (younger: 23.1% vs older: 25.2%; P = .004) and lower rates of persons below the poverty level threshold (younger: 17.1% vs older: 16.5%; P = .04). The older cohort was much more likely to have previously reported MDS (younger: 25.1% vs older: 34.1%; P = .01) and less likely to have previously reported MPN (younger: 31.9% vs older: 19.6%; P < .001).
Mutation Frequency and Cytogenetics
The combined population had a 19.8% rate of FLT3 mutation and a 22.1% rate of NPM1 mutation, and 59.3% had double-negative disease (FLT3–/NPM1–) and 10.2% having double-positive disease (FLT3+/NPM1+). The younger cohort was more likely to be FLT3- positive (24.9% vs 13.9%; P < .001) with no differences detected between age cohorts in rates of NPM1 positivity. Younger patients were also more likely to be double-positive than older patients (13.3% vs 6.5%; P = .002) and less likely to be solely NPM1+ (9.2% vs 14.8%; P = .02). Of note, VUMC patients were more likely to have FLT3 mutations than VHA patients (VUMC: 25.3% vs VHA: 12.5%; P < .001). Younger patients were less likely to have unfavorable cytogenetics (26.3% vs 35.2%; P = .01) and more likely to have favorable cytogenetics (9.2% vs 2.3%; P < .001).
Overall Survival Analysis
In an unweighted, unadjusted analysis, age was a significant factor in OS among patients with AML, with older patients showing significantly worse outcomes than younger patients (median OS: 24.3 months vs 8.2 months; P < .001) (Figure 1). Cytogenetic risk status was a major factor in OS among patients with AML. Median OS was not reached in the favorable group, was 17.6 months for intermediate/normal, and 6.8 months for unfavorable (P < .001), an influence that held within the age-stratified cohorts (Figure 2). Although cytogenetics did have an influence on OS in the older cohort, the effect was diminished: median OS was 9.7 months for the favorable group, 9.8 months for the intermediate/ normal, and 5.2 months for the unfavorable (P = .001). Patients in the older cohort with favorable cytogenetics showed similar survival as younger cohort patients with unfavorable cytogenetics (9.7 months vs 8.3 months, respectively).
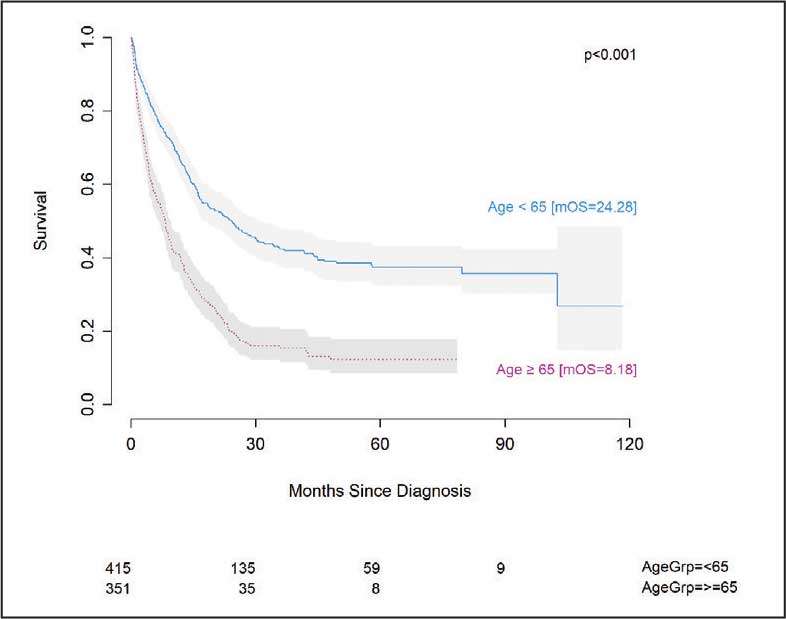
patients with acute myeloid leukemia showing
number at risk.
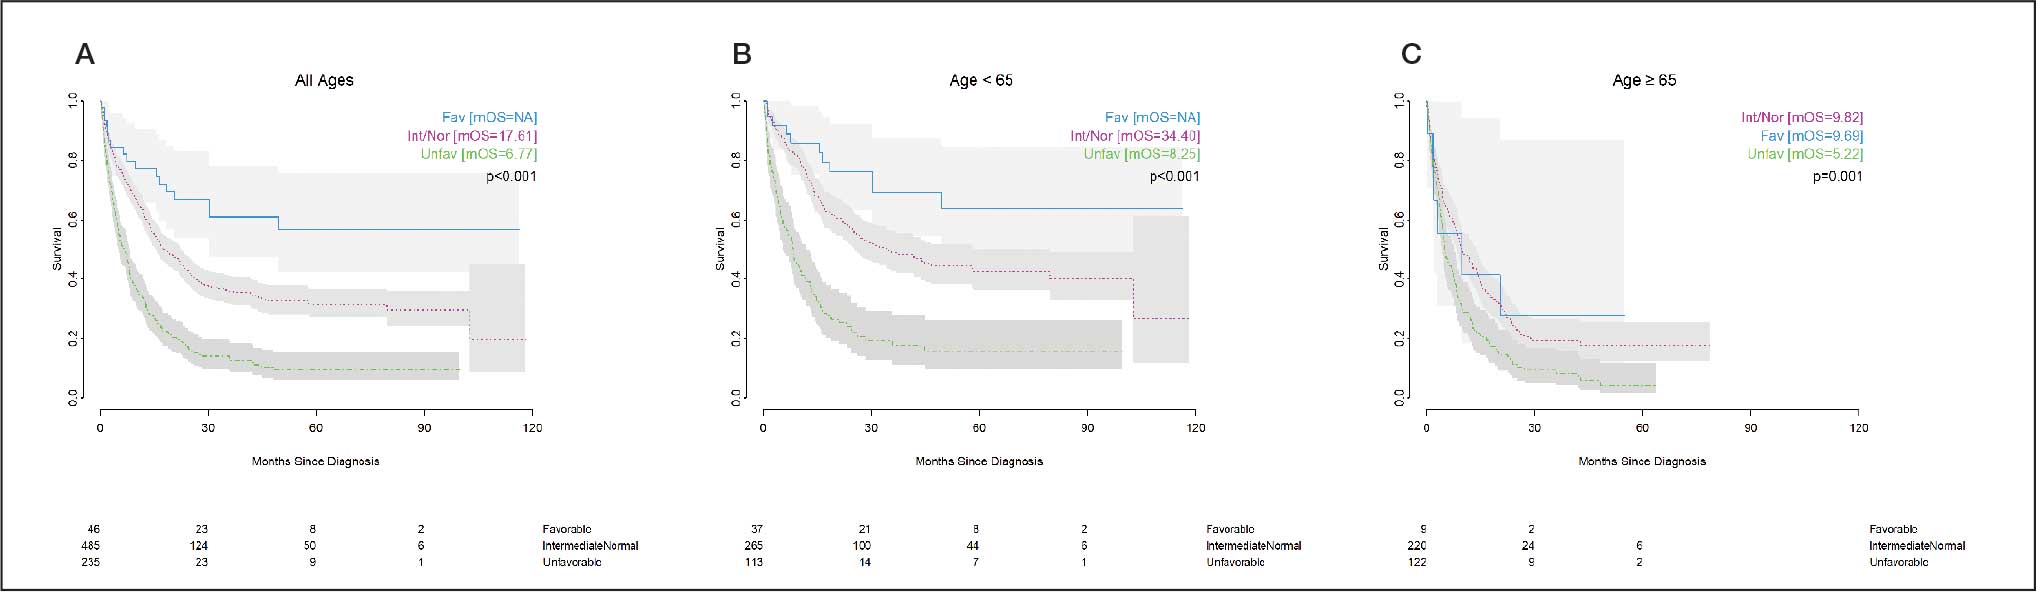
(blue solid line), intermediate/normal cytogenetics (pink dotted line), and unfavorable cytogenetics (green dashed line).
A, all ages; B, aged < 65 y; C, aged ≥ 65 y. Abbreviations: AML, acute myeloid leukemia; fav, favorable; Int/Nor, intermediate/normal; mOS, median overall survival; Unfav, unfavorable.
NPM1 and FLT3 mutations were prognostic factors for OS when looking at comutation groups. Across all ages, those with NPM1 mutation in the setting of wild-type FLT3 had the most favorable outcomes, with significantly better outcomes than patients with wild-type NPM1 and wild-type FLT3 (double-negative): 25.8 months vs 12.7 months, respectively. However, this effect was driven almost entirely by the younger cohort (< 65 years) with little difference in OS seen between mutation groups in the older cohort (Figure 3). Although not reaching significance, we observed a similar pattern in the subset of patients with normal/intermediate-risk cytogenetics, where the trend of differences in overall outcomes was also driven by the younger cohort (P = .09) vs the older cohort (P = .44) (Figure 4).
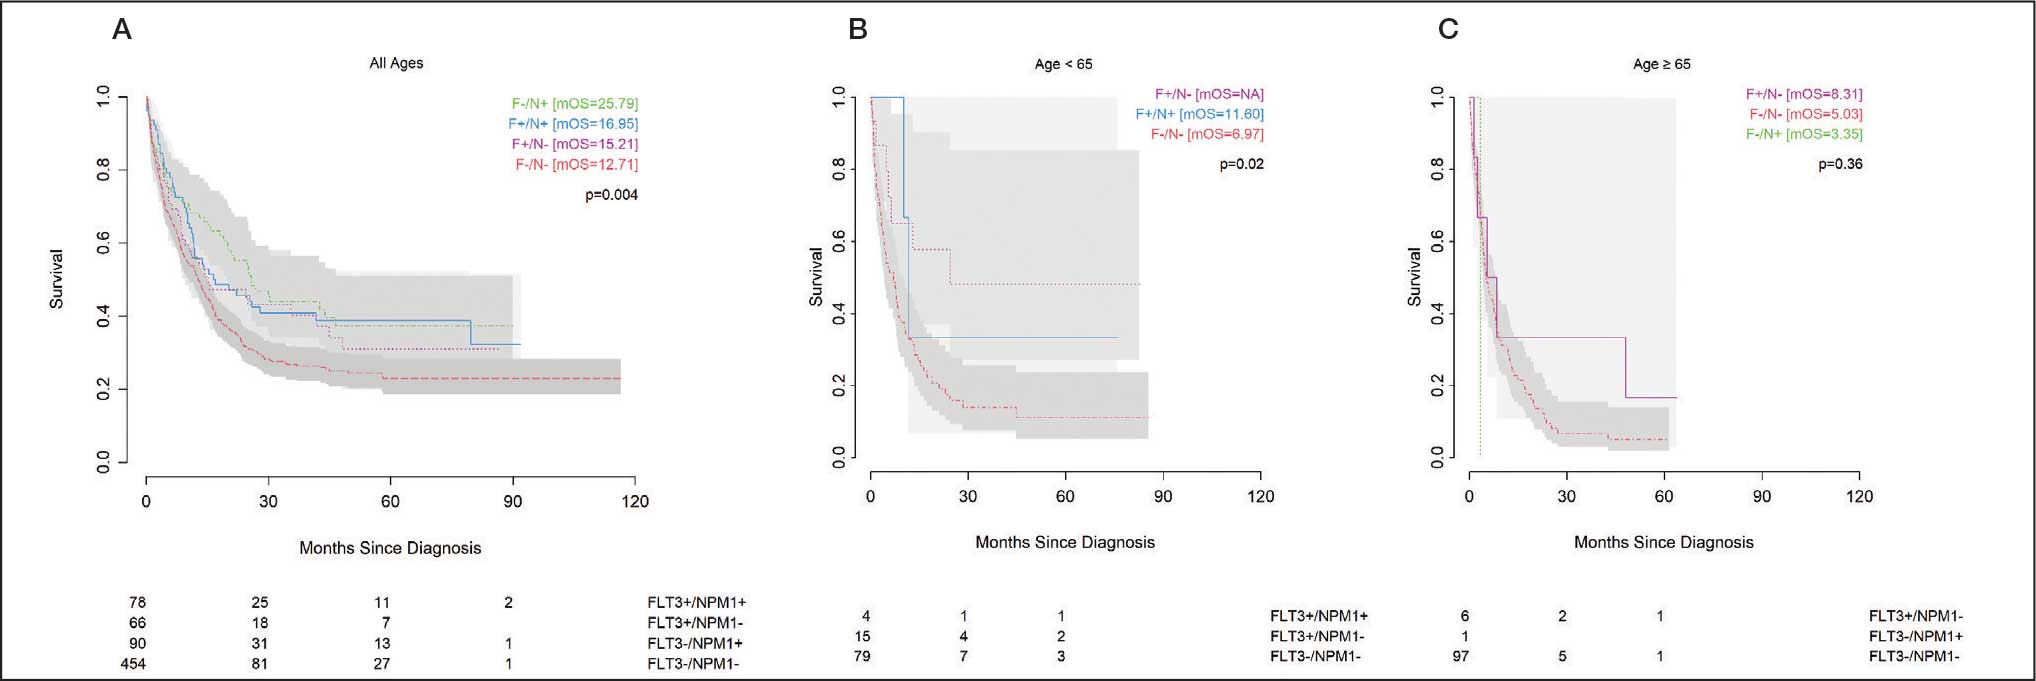
mutation (green dashed line), wild-type FLT3 and wild type NPM1 (red dashed line), FLT3 ITD or TKD and wild-type NPM1
(pink dotted line), or FLT3 ITD or TKD and mutated NPM1 (blue solid line). A, all ages; B, aged < 65 y; C, aged ≥ 65 y.
Abbreviations: AML, acute myeloid leukemia; ITD, internal tandem domain; mOS, median overall survival; TKD, tyrosine kinase domain.
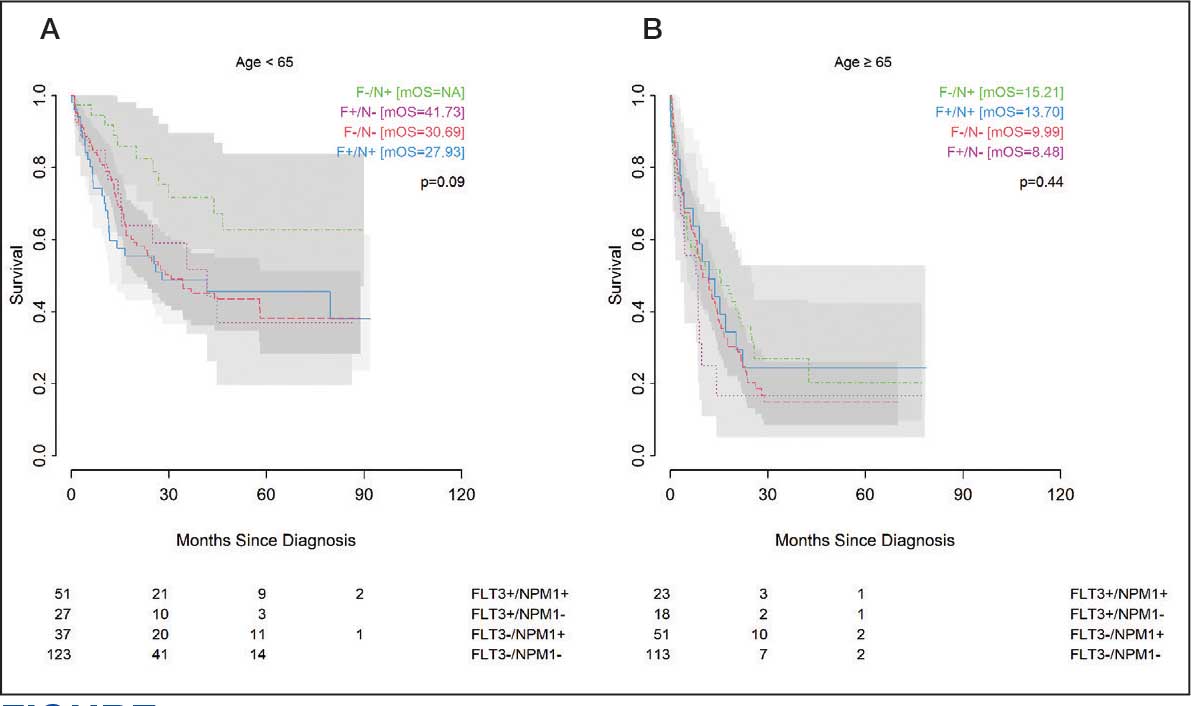
with wild-type FLT3 and NPM1 mutation (green dashed line), wild-type
FLT3 and wild-type NPM1 mutations (red dashed line), FLT3 ITD or
TKD and wild-type NPM1 (pink dotted line), or FLT3 ITD or TKD and
mutated NPM1 (blue solid line). Number at risk shown. A, aged < 65 y;
B, aged ≥ 65 y.
Abbreviations: AML, acute myeloid leukemia; ITD, internal tandem domain; mOS, median overall
survival; TKD, tyrosine kinase domain.
Of note, in both whole-group analyses and when restricted to normal/intermediate karyotype, the most favorable prognostic group (FLT3–/NPM1+) among older patients showed a worse OS (median, 15.2 months) compared with the poor prognostic group (NPM1–/ FLT3–) among younger patients (median, 18.4 months). In older and younger patients with unfavorable cytogenetics, patients with FLT3+ status showed better OS than patients with wild-type FLT3, though the difference was only significant within the younger patient population (Figure 5). The unfavorable cytogenetic risk group had no patients with NPM1+/FLT3– disease in the younger cohort and no patients with NPM1+/FLT3+ disease in the older cohort.
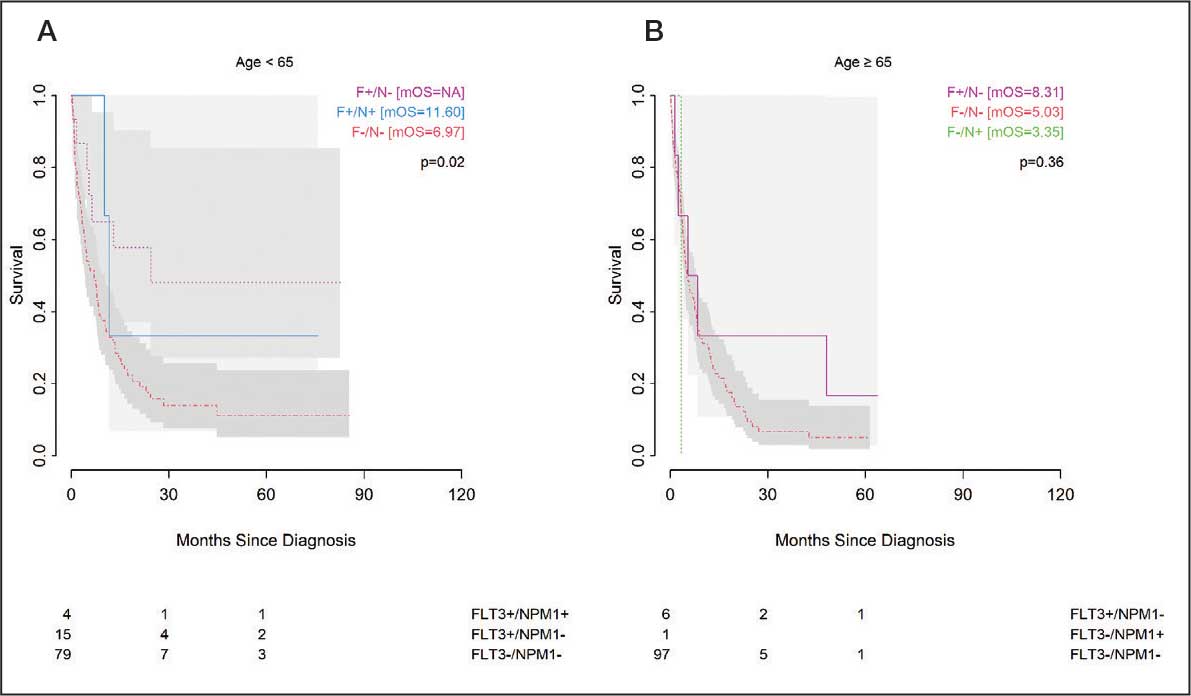
AML with wild-type FLT3 and NPM1 mutation (green dashed line),
wild-type FLT3 and wild-type NPM1 mutations (red dashed line),
FLT3 ITD or TKD and wild-type NPM1 (pink dotted line), or FLT3 ITD
or TKD and mutated NPM1 (blue solid line). Number at risk shown.
A, aged < 65 y; B, aged ≥ 65 y.
Abbreviations: AML, acute myeloid leukemia; ITD, internal tandem domain;
mOS, median overall survival; TKD, tyrosine kinase domain.
Multivariable Analysis
In multivariable Cox PH analysis, age at diagnosis, unfavorable cytogenetic risk status, higher CCI scores, and prior MPN diagnosis were selected by the LASSO method as having a significant effect on outcomes in the combined cohort of all ages. Age at diagnosis showed negative prognostic value (hazard ratio [HR] 65 y vs 35 y, 2.44; 95% CI, 1.61-3.68; P < .001), as did unfavorable cytogenetics (HR, 1.68; 95% CI, 1.34-2.11; P = .001), and CCI score (2 vs 0 CCI HR, 1.51; 95% CI, 1.16-1.98; P = .003). Prior MPN diagnosis was a favorable prognostic feature (HR, 0.51; 95% CI, 0.40-0.67; P < .001). While not reaching significance in the multivariable analysis, FLT3 mutation trended toward a negative prognostic value (HR, 1.25; 95% CI, 0.96-1.62; P = .10) and NPM1 mutation trended toward a positive prognostic value (HR, 0.81; 95% CI, 0.62-1.05; P = .11).
In a multivariable analysis restricted to patients aged < 65 years, unfavorable cytogenetic risk status and CCI score were negative prognostic factors. Prior MPN diagnosis had positive prognostic significance. In this younger population, LASSO analysis also identified treatment at VHA as a positive prognostic factor (HR, 0.48; 95% CI, 0.26-0.89; P = .02). In patients aged ≥ 65 years, prior MPN diagnosis was again a favorable prognostic feature (HR, 0.53; 95% CI, 0.37-0.77; P < .001) and negative prognostic feature (HR, 3.67; 95% CI, 1.32-10.17; P = .02). NPM1 mutation status (P = .48), favorable karyotype (P = .54), and CCI (P = .13) were not statistically significant prognostic factors for OS in the older cohort. In the older cohort, FLT3 mutation trended toward a worse prognosis (HR, 1.39; 95% CI, 0.94-2.06) but did not reach statistical significance (P = .10). Within the age-stratified cohort, age was a significant factor in OS, and older age was associated with increased risk for death (85 years vs 65 years HR, 2.73; 95% CI, 1.46-5.11; P = .002).
Discussion
Age, cytogenetics, and antecedent hematologic malignancy or previous history of chemotherapy have long been recognized as prognostic factors in AML. Advanced age has also been identified as a poor prognostic factor, either reflecting increased comorbidities in older patients or due to a distinct biology in geriatric AML.4,8,35-37 Various recurrent molecular mutations have been identified as important prognostic factors as well.38 In particular, FLT3-ITD mutations are considered poor prognostic factors, particularly in the setting of wild-type NPM1. Many of the data used to determine the potential impact of FLT3 and NPM1 mutations have been derived from younger patients who are better able to withstand intensive induction chemotherapy than older patients. Our study examined the age-dependent prognostic factors on OS from an unrestricted nationwide cohort of 327 veterans treated at the VHA and 439 patients treated at an academic medical center. This study of patients diagnosed and treated at VHA or VUMC represents one of the largest examinations of molecular prognostic factors in the older population of patients with AML.
This study examined the prevalence and prognostic impact of NPM1 and FLT3 mutations in a population of patients with AML. Older patients were more likely to have a higher CCI, antecedent MDS, and unfavorable karyotype, while younger patients were more likely to have had an antecedent MPN. The older cohort showed a rate of NPM1 mutations similar to that of the younger cohort. The prevalence of NPM1 and FLT3 mutations in this study is statistically significantly different than that typically reported from younger AML cohorts but mirrors findings seen in other studies of geriatric patients with AML.39-42
The older AML cohort has a decreased prevalence of FLT3 mutations.43 While FLT3-ITD is generally considered a poor prognostic factor, the older cohort showed worse OS, both overall and in each of the 4 mutation subgroups. This was not merely a reflection of the increased rates of unfavorable karyotype among the older cohort as the lack of prognostic impact of FLT3 and NPM1 was also observed when excluding patients with an unfavorable karyotype. In fact, when considering outcomes among patients aged ≥ 65 years, favorable karyotype, NPM1 status, and FLT3 status were not statistically significant prognostic factors in a multivariable analysis. Among older patients with AML, Medicaid as a payor was a poor prognostic factor, likely reflecting the impact of lower socioeconomic status on outcome. Interestingly, in the younger and older cohorts, antecedent MPN was a positive prognostic factor, possibly reflecting the widespread and highly effective use of BCR-ABL inhibitors in patients with AML with BCR-ABL translocations or perhaps a generally slower course of AML in diseases with antecedent MPN. In younger patients, comorbidities and favorable karyotype remained poor prognostic factors, as expected.13 Moreover, in the younger cohort, therapy within the VHA was a favorable prognostic factor, possibly reflecting the fact that VUMC acts as a regional referral center, attracting therapy-resistant patients that would normally be treated in the community. Again, in the younger cohort, FLT3 and NPM1 mutations were not significantly associated with outcome when considered individually, although patients with NPM1+/FLT3– disease trended to the best outcome and those with FLT3–/NPM1– disease trended toward a worse outcome.
We observed that among patients with AML aged ≥ 65 years (the majority) the prognostic impact of favorable karyotype, FLT3 mutations, and NPM1 mutations on OS was not statistically significant. Although numerous studies have shown a prognostic impact of FLT3 and NPM1 mutation status, those studies typically underrepresented older patients or excluded patients who could not undergo intensive induction chemotherapy.5,18,24,39,44 Other studies focusing on older patients with AML show similar findings to our study, although often with smaller cohorts.
Scholl et al examined 99 patients with AML who were aged ≥ 60 years; 23 had NPM1 mutations and 16 had the FLT3-ITD mutation.45 While NPM1 status had no impact on OS, even when restricted to the FLT3-ITD-negative subset, patients with FLT3-ITD mutations treated with curative therapy (7 patients) showed a shorter OS (634 days vs 210 days; P = .03) than those without FLT3-ITD mutations (47 patients). Daver et al examined patients aged ≥ 65 years with AML with NPM1 (146 patients) and FLT3 (388 patients). While neither mutation alone showed statistically significant impact on OS in the older AML cohort, 14 patients with NPM1-mutated/ FLT3–wild-type subset showed extended OS (21.5 months) compared with all other subsets (9.0 months).42 Finally, a review of 156 patients treated on SWOG protocols failed to find a significant prognostic impact from NPM1 or FLT3 mutations, either separately or in combination, in the older AML cohort (≥ 65 years).41
These authors also reviewed outcomes from a cohort of 1258 UK Medical Research Council/ National Cancer Research Institute patients, which included 448 patients aged ≥ 65 years and 810 patients aged 55 to 65 years. Older patients with NPM1-mutated/FLT3–wild-type AML showed no statistically significant improved OS compared with all other molecularly defined subsets, whereas younger patients with NPM1-mutated/FLT3–wild-type AML did show improved OS, as predicted from earlier studies of younger patients with AML. Juliusson et al studied 1570 adult patients from the Swedish AML registry and identified differences in the prognostic value of NPM1 and FLT3 among patients aged 60 to 74 years vs patients aged < 60 years.33 FLT3-ITD was a marker for poor prognosis in younger patients (P = .00003) but not in older patients. However, in contrast to our findings, NPM1 mutation was a positive prognostic marker only in the older population (P = .00002). An age-stratified analysis by Straube et al observed that an NPM1+/ FLT3-ITD–low status confers a poorer prognosis than NPM1+/FLT3– status in younger patients (aged < 60 years) but not in older patients (aged ≥ 60 years), in which both mutation groups have similarly poor outcomes.32
Our study affirms these previous real-world analyses that show little or no impact of FLT3 and NPM1 mutations among older patients with AML. Moreover, this study extends those previous findings by including karyotype classification to show that FLT3 and NPM1 status show no impact even within karyotype subclasses in older patients with AML. Notwithstanding our findings and those from previous studies, the NCCN and European LeukemiaNet guidelines still define AML risk groups based on molecular findings without a recognition that patients aged > 65 years are likely to have poor outcomes, regardless of mutation status and irrespective of comorbidities.13,37 Moreover, because older individuals comprise most patients with AML, the guidelines may better serve the patient population if they were structured primarily on age and then considered special circumstances in younger patients with different mutations.
Limitations
Over a 10-year time horizon, therapy was variable between patients and likely influenced by patient presentation, age, and comorbidities. We believe that younger patients were more likely to receive intensive induction therapy and older patients were likely to receive less intense regimens, though we do not have therapeutic data available to confirm that hypothesis. Also, these data cannot account for changes in therapeutic paradigms over time. Increased use of demethylating agents in patients with MDS and in the geriatric population of patients with AML was not assessed in this study. The use of midostaurin or other kinase inhibitors may have varied throughout the study, although the period analyzed predates widespread use of FLT3-specific inhibitors. Additionally, our data do not reflect the newer treatment regimens that have improved outcomes in older patients with AML. Moreover, the survival data were not censored at stem cell transplant for the minority of patients who may have received one. Although stem cell transplant is unlikely to have been prevalent among the older cohort, among the younger patients, stem cell transplantation in the poor prognostic subgroups may have led to improved outcomes, giving those younger, high-risk patients outcomes similar to intermediate-risk patients and obscuring the negative impact of poor prognostic factors, such as FLT3 mutation and unfavorable cytogenetics.
In addition, there may be some limitations in the predominantly male, older VHA cohort, although patient features were adjusted when measured. As the VHA patients tended to skew older, and as antecedent MDS has been shown to be a poor prognostic factor, underreporting of MDS in the VHA cohort would worsen the predicted outcome of the older cohort, which may explain why the older patients did so much worse across all molecularly defined subgroups. However, if there were significant underreporting of MDS among VHA patients, receiving therapy at the VHA, particularly for older patients, should have been a poor prognostic factor. In fact, older VHA patients did not have a worse outcome than those treated at the academic center, and in the younger cohort, treatment at the VHA was a good prognostic factor (HR, 0.48; 95% CI, 0.26-0.89; P = .02). The worse outcome of younger patients at the academic center may be reflective of its role as a referral center for the most challenging patients for nonacademic, community hematologists.
Conclusions
The results of this study suggest that patient age is the most significant prognostic factor in AML. Our findings may be complicated by the variability of therapy used in older patients, but that variation in treatment reflects the biologic reality that these patients are often not able to tolerate the same treatments as younger patients. In essence, by not restricting this analysis to the healthiest of the older adults or to a population that skews significantly younger than the typical patient with AML, our results reflect the grim reality facing physicians who care for older patients with AML: there are no good prognostic groups. In an era burgeoning with new therapies, we must be cognizant of the complete spectrum of patients with leukemia rather than developing prognostic algorithms and focusing trials primarily on the youngest and healthiest patients.
