
Tranexamic Acid Reduces Perioperative Blood Loss and Hemarthrosis in Total Ankle Arthroplasty


TAKE-HOME POINTS
- TXA is an inexpensive and effective hemostatic agent used during TAA.
- The ankle has a thin soft tissue envelope that does not have elaborate elastic properties. The soft tissue release and bleeding surfaces of bone during TAA are not as extensive when compared to TKA and THA, but the intra-articular volume is smaller and surrounding soft tissues may be less yielding when blood accumulation occurs.
- If no major contraindication is present, routine use of TXA is recommended to assist in blood loss management during TAA.
- TXA decreases postoperative hemarthrosis and helps to reduce the risk of postoperative wound complications.
- The administration of TXA in the appropriate patient has the potential to decrease hospital cost by controlling postoperative pain and swelling allowing for earlier discharge.
Charts were reviewed for demographics, preoperative and postoperative hemoglobin levels, indications for surgery, surgical procedures, length of surgery, postoperative drain output, length of stay, postoperative pain visual analog scale (VAS) score, minor and major wound complications, and postoperative complications. Minor wound complications were defined as the anterior surgical incision that required local wound care in office or oral antibiotics without subsequent consequences. Major wound complications were defined as requiring surgical débridement and/or any additional treatment in the operating room.16 Postoperative complications other than wound complications were defined as those requiring a subsequent surgical intervention. Patient demographics and clinical and procedural characteristics of patients in both the TXA-TAA and the No TXA-TAA groups are outlined in Table 1. There were 14 males and 11 females in the TXA-TAA group and 16 males and 9 females in the No TXA-TAA group. The mean age was 65.8 ± 10.9 years in the TXA-TAA group and 66.9 ± 8.0 years in the No TXA-TAA group (P = .69). Mean body mass index (BMI) was 31.6 ± 6.3 in the TXA-TAA group and 29.4 ± 4.9 in the No TXA-TAA group (P = .18). The primary indication for TAA was degenerative osteoarthritis in 26 patients, posttraumatic arthritis in 21 patients, and rheumatoid arthritis in 3 patients. The most common associated procedure was Achilles tendon lengthening in both groups. The mean follow-up in the TXA-TAA group was 9.3 ± 5.8 months (range, 2.0-24.0 months). Postoperative complications due to TXA administration as described in previous literature were defined as VTE, myocardial infarction, or ischemic cerebral event. The TXA-TAA group received a standard 1 g dose of IV TXA 20 minutes prior to tourniquet inflation. A tourniquet was used intraoperatively on all patients included in this study. A postoperative 400-mL surgical drain (Hemovac, Zimmer Biomet) was placed in the ankle joint in all patients and subsequently discontinued on postoperative day 1. Recent literature has reported the minor wound complication rate associated with TAA to be as high as 25% and the major wound complication rate to be 8.5%.16 To assist in reducing the risk for wound complications, our protocol traditionally uses an intra-articular surgical drain to decrease any pressure on the wound from postoperative hemarthrosis.
| |||||||||||||||||||||||||||||||||||||||||||||||||||||||||||||||||||||||||||||||||||||||||||||||||||||||||||||||||||||||||||||
| |||||||||||||||||||||||||||||||||||||||||||||||||||||||||||||||||||||||||||||||||||||||||||||||||||||||||||||||||||||||||||||
aP value was calculated from t-test continuous variables and Chi-square test for categorical variables (TXA-TAA vs No TXA-TAA comparison).
Abbreviations: ASA, American Society of Anesthesiologists; BMI, body mass index.
Total drain output was recorded in milliliters (mL) in all patients. The change between the preoperative hemoglobin level and the hemoglobin level on postoperative day 1 was calculated for each patient. The calculated blood loss was determined using Meunier’s equation, which estimates the total blood volume using Nadler’s formula and then uses preoperative hemoglobin and postoperative day 1 hemoglobin values to calculate blood loss.17,18 VAS scores (scale, 1-10) were obtained every 4 hours on postoperative day 1 according to the nursing protocol. The number 1 on the scale represents the least amount of pain, whereas 10 indicates the worst pain. The VAS scores were then averaged for each patient.
A power analysis using preliminary data determined that 15 patients were needed in each group to detect a 50% reduction in drain output at a power of 80% and a P value of 0.05. Descriptive statistics were used to analyze demographic data. We compared the demographic and clinical characteristics of patients in the TXA-TAA group with those of patients in the No TXA-TAA group using unpaired student t-tests for continuous variables and Chi-square or Fischer’s exact tests for categorical variables. Simple and adjusted linear regression analyses were used to examine the difference in drain output and blood loss between the 2 groups (TXA-TAA vs No TXA-TAA). Multivariate models were adjusted for age, BMI, and length of surgery. A P value <.05 was considered to be statistically significant. We performed all analyses using a statistical software package (SAS version 9.2, SAS Institute).
RESULTS
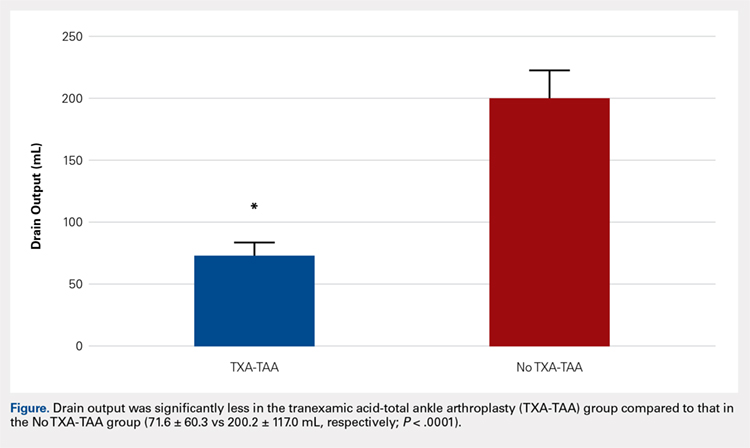
Drain output was significantly less in the TXA-TAA group compared to that in the No TXA-TAA group (71.6 ± 60.3 vs 200.2 ± 117.0 mL, respectively, P = .0001) (Figure). The clinical characteristics of the patients who underwent TAA with the use of TXA are outlined in Table 2. The mean change in preoperative to postoperative hemoglobin levels was significantly lower in the TXA-TAA group than in the No TXA-TAA group (1.5 ± 0.6 vs 2.0 ± 0.4 g/dL, respectively; P = .01). The calculated blood loss in patients in the TXA-TAA group was significantly lower than that in patients in the No TXA-TAA group (649.9 ± 332.7 vs 906.8 ± 287.4 mL, respectively; P = .01). No patient in either group received a blood transfusion. We did not observe a significant difference in the length of surgery between the TXA-TAA and the No TXA-TAA groups (112.8 ± 24.8 vs 108.6 ± 26.0 min, respectively; P = .57). The average American Society of Anesthesiologists’ (ASA) classification was similar between the groups (2.2 ± 0.6 and 2.2 ± 0.5, respectively; P = 1.00) as was the age-adjusted Charlson Comorbidity Index (2.8 ± 1.7 vs 2.9 ± 1.6, respectively; P = .93). Mean VAS scores on postoperative day 1 in the TXA-TAA and the No TXA-TAA group were 4.9 ± 1.7 and 5.3 ± 1.4, respectively (P = .71). The average length of stay in the TXA-TAA group was 1.6 ± 0.7 days vs 1.3 ± 0.6 days in the No TXA-TAA group (P = .23). Two patients in the TXA-TAA group had an extended hospital length of stay of 5 days due to discharge planning and social issues.
Table 2. Clinical Characteristics of Total Ankle Arthroplasty (TAA) Patients by Use of Tranexamic Acid (TXA), N = 50 | |||
|---|---|---|---|
TXA use in TAA | P valuea | ||
Yes (n = 25 cases) | No (n = 25 controls) | ||
Clinical Characteristic | |||
Drain Output (ml), mean ± SD | 71.6 ± 60.3 | 200.2 ± 117.0 | <0.0001 |
Preoperative to Postoperative Hgb Change (g/dL), mean ± SD | 1.5 ± 0.6 | 2.0 ± 0.4 | 0.01 |
Blood Loss Calculated (ml), mean ± SD | 649.9 ± 332.73 | 906.8 ± 287.4 | 0.01 |
Length of Surgery (min), mean ± SD | 112.8 ± 24.8 | 108.6 ± 26.0 | 0.57 |
VAS scores on the POD (No.), mean ± SD | 4.9 ± 1.7 | 5.3 ±1.4 | 0.71 |
LOS (day), mean ± SD | 1.6 ± 0.7 | 1.3 ± 0.6 | 0.23 |
aP value was calculated from t-test for continuous variables, and Chi-square test for categorical variables (TXA-TAA vs No TXA-TAA comparison).
Abbreviations: LOS, length of stay; VAS, visual analog scale; POD, postoperative day.
Table 3. Linear Regression Analyses of Drain Output and Blood Loss using Tranexamic Acid (TXA) in Total Ankle Arthroplasty (TAA), Unadjusted and Adjusted Models for Length of Surgery, N = 50 | ||||
TXA Use in TAA (Yes vs No) | ||||
Drain Output (mL) | Regression coefficient (β) | SE | Test statistics (t) | P valuea |
Unadjusted Model | -128.6 | 26.3 | -4.89 | < 0.0001 |
Adjusted for Age | -129.6 | 26.5 | -4.89 | <0.0001 |
Adjusted for BMI | -121.8 | 26.6 | -4.57 | <0.0001 |
Adjusted for Length of Surgery | -129.6 | 26.6 | -4.86 | <0.0001 |
Multivariable Modelb | -123.4 | 27.1 | -4.55 | <0.0001 |
Blood Loss (mL) | ||||
Unadjusted Model | -257.0 | 87.9 | -2.92 | 0.005 |
Adjusted for Age | -263.7 | 87.4 | -3.02 | 0.004 |
Adjusted for BMI | -268.7 | 90.2 | -2.98 | 0.005 |
Adjusted for Length of Surgery | -261.3 | 88.6 | -2.94 | 0.005 |
Multivariable Modelb | -275.6 | 90.7 | -3.04 | 0.004 |
aLinear regression was used to calculate the P value. bAdjusted for age, BMI and length of surgery.
Abbreviation: BMI, body mass index.
Table 4. Patient Wound Complication Categories by Use of Tranexamic Acid (TXA) in Total Ankle Arthroplasty (TAA), N = 50 | |||
|---|---|---|---|
TXA Use in TAA | P valuea | ||
Wound Complication | Yes (n = 25 cases) | No (n = 25 controls) | 0.114 |
None, n = 46 (86%) | 23 (40%) | 20 (46%) | |
Minor, n = 6 (12%) | 2 (4%) | 4 (8%) | |
Major, n = 1 (2%) | 0 (0%) | 1 (4%) | |
aP value was calculated from Fisher’s Exact test (67% cells had count <5) test for categorical variables (TXA-TAA vs No TXA-TAA comparison).
The crude linear regression model revealed a significant difference in drain output between the TXA-TAA and the No TXA-TAA groups (β = −128.6 ± 26.3, P < .0001) (Table 3). Further adjustment for age and length of surgery slightly strengthened the association (β = −129.6 ± 26.6, P < .0001). The nature of regression coefficient β showed that the mean estimate of drain output was 129.6 mL lower in the TXA-TAA group than that in the No TXA-TAA group. There was a significant difference in blood loss between the TXA-TAA and the No TXA-TAA groups in the crude linear regression model (β = −257.0 ± 87.9, P = .005). Additional adjustment for age, BMI, and length of surgery slightly strengthened the association (β = −275.6 ± 90.7, P = .004). The nature of regression coefficient β showed that the mean estimate of blood loss was 275.6 mL lower in the TXA-TAA group than in the No TXA-TAA group (Table 3).
Continue to: There was no statistically significant difference...

