
Timing of Adverse Events Following Geriatric Hip Fracture Surgery: A Study of 19,873 Patients in the American College of Surgeons National Surgical Quality Improvement Program


TAKE-HOME POINTS
- The median postoperative day of diagnosis for myocardial infarction was 3, 3 for cardiac arrest requiring cardiopulmonary resuscitation, 3 for stroke, 4 for pneumonia, 4 for pulmonary embolism, 7 for urinary tract infection, 9 for deep vein thrombosis, 9 for sepsis, 11 for mortality, and 16 for surgical site infection.
- For the earliest diagnosed adverse events, the rate of adverse events had diminished by postoperative day 30; however, for the later diagnosed adverse events, the rate of adverse events remained high at postoperative day 30.
- The proportions of adverse events diagnosed prior to discharge were 81.0% for myocardial infarction, 77.8% for stroke, 76.1% for cardiac arrest requiring cardiopulmonary resuscitation, 71.9% for pulmonary embolism, 71.1% for pneumonia, 58.0% for urinary tract infection, 52.1% for sepsis, 46.9% for deep vein thrombosis, 44.3% for mortality, and 27.6% for surgical site infection.
- These results facilitate targeted clinical surveillance, guide patient counseling, and inform the duration of follow-up required in research studies.
- Clinicians should have the lowest threshold for testing for each adverse event during the time period of greatest risk.
RESULTS
In total, 19,873 geriatric patients undergoing a hip fracture surgery were identified (Table 1). The rates of adverse events ranged from 6.7% for urinary tract infection to 0.6% for pulmonary embolism (Table 2).
Table 1. Patient Population
Number | Percent | |
Total | 19,873 | 100.0% |
Age | ||
70-74 years | 1852 | 9.3% |
75-79 years | 2764 | 13.9% |
80-84 years | 4328 | 21.8% |
85-89 years | 5525 | 27.8% |
≥90 years | 5404 | 27.2% |
Sex | ||
Male | 5359 | 27.0% |
Female | 14,514 | 73.0% |
Body mass index | ||
<30 kg/m2 | 17,733 | 89.2% |
≥30 kg/m2 | 2140 | 10.8% |
Functional status | ||
Independent | 14,348 | 72.2% |
Dependent | 5525 | 27.8% |
Diabetes | 3321 | 16.7% |
Congestive heart failure | 738 | 3.7% |
Dyspnea on exertion | 1542 | 7.8% |
Hypertension | 14,265 | 71.8% |
End-stage renal disease | 322 | 1.6% |
COPD | 2239 | 11.3% |
Current smoker | 1506 | 7.6% |
Abbreviation: COPD, chronic obstructive pulmonary disease.
Table 2. Patients with Adverse Events Diagnosed During the First 30 postoperative days (N = 19,873)
Adverse Event | Number | Percent | 95% CI |
Urinary tract infection | 1321 | 6.7% | 6.3%-7.0% |
Mortality | 1240 | 6.2% | 5.9%-6.6% |
Pneumonia | 771 | 3.9% | 3.6%-4.2% |
Sepsis | 428 | 2.2% | 2.0%-2.4% |
Myocardial infarction | 347 | 1.8% | 1.6%-1.9% |
Surgical site infection | 247 | 1.2% | 1.1%-1.4% |
Deep vein thrombosis | 199 | 1.0% | 0.9%-1.1% |
Stroke | 144 | 0.7% | 0.6%-0.8% |
Cardiac arrest | 136 | 0.7% | 0.6%-0.8% |
Pulmonary embolism | 126 | 0.6% | 0.5%-0.7% |
Abbreviation: CI, confidence interval.
Figure 1 depicts the timing of postoperative adverse events in detail in histograms and timing curves. For the earliest diagnosed adverse events, the rate of adverse events had diminished by postoperative day 30. For the later diagnosed adverse events, the rate of adverse events remained high at postoperative day 30.
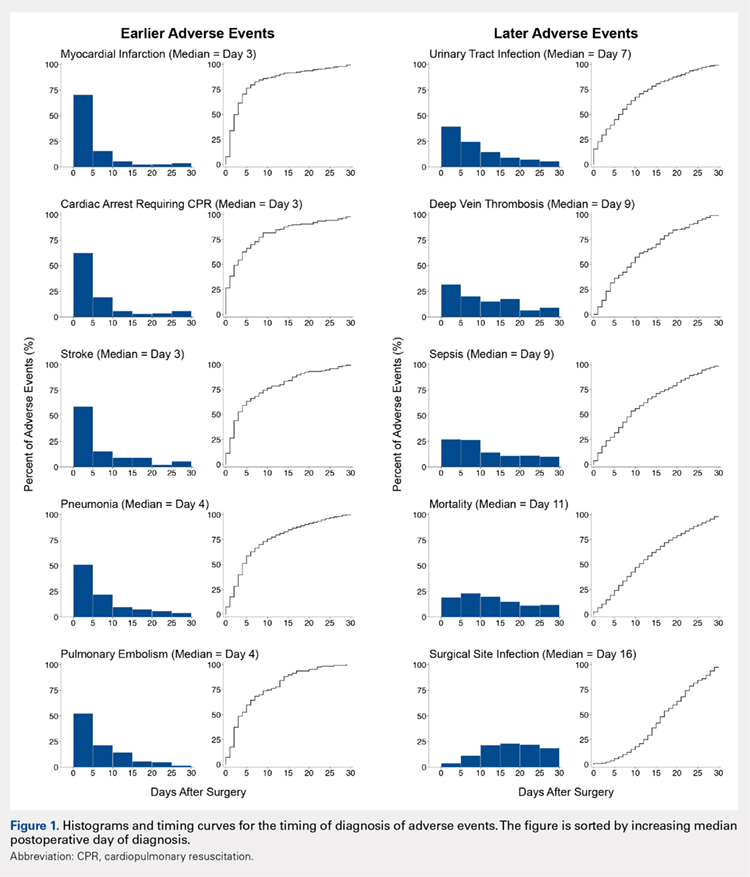
Figure 2 provides the summary statistics for adverse events diagnosed in the first 30 postoperative days. The median postoperative day of diagnosis (and the interquartile range) was 3 (1-5) for myocardial infarction, 3 (0-8) for cardiac arrest requiring cardiopulmonary resuscitation, 3 (1-10) for stroke, 4 (2-10) for pneumonia, 4 (2-11) for pulmonary embolism, 7 (2-13) for urinary tract infection, 9 (4-16) for deep vein thrombosis, 9 (4-18) for sepsis, 11 (6-19) for mortality, and 16 (11-22) for surgical site infection.
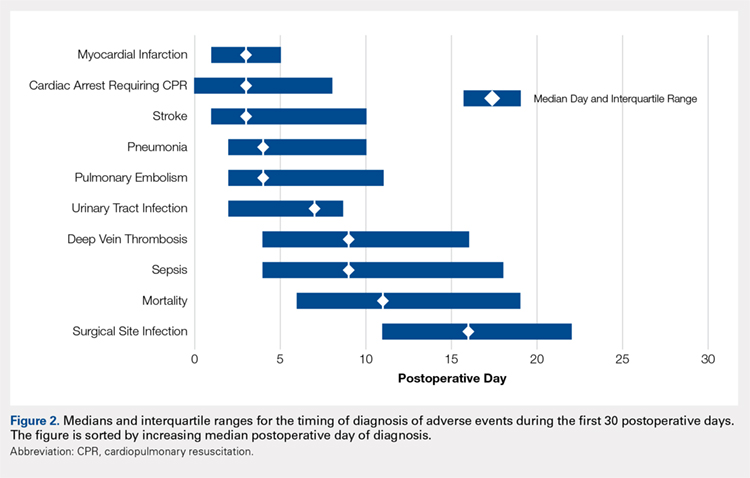
Figure 3 depicts the timing of adverse events relative to discharge. The proportions of adverse events diagnosed prior to discharge were 81.0% for myocardial infarction, 77.8% for stroke, 76.1% for cardiac arrest requiring cardiopulmonary resuscitation, 71.9% for pulmonary embolism, 71.1% for pneumonia, 58.0% for urinary tract infection, 52.1% for sepsis, 46.9% for deep vein thrombosis, 44.3% for mortality, and 27.6% for surgical site infection.
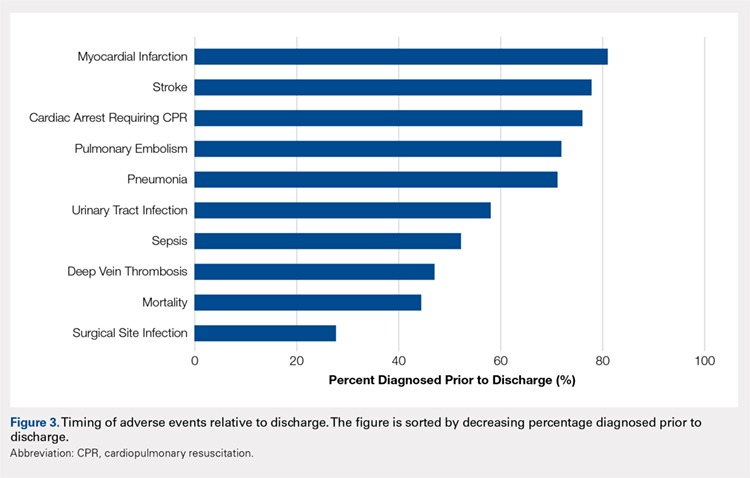
Table 3 shows the independent risk factors for earlier occurrence of adverse events. Following multivariate stepwise selection of final models, at least 1 patient characteristic was independently associated with the timing of cardiac arrest, stroke, urinary tract infection, deep vein thrombosis, and death. In contrast, no patient characteristics were independently associated with the timing of myocardial infarction, pneumonia, pulmonary embolism, sepsis, and surgical site infection.
Table 3. Timing of Diagnosis of Adverse Eventsa
Adverse events and associated baseline characteristic(s) | Median postoperative day of diagnosis with vs without baseline characteristic | P-valueb |
Cardiac arrest | ||
End-stage renal disease | 1 vs 3 | .005 |
Stroke | ||
Hypertension | 4 vs 2 | .025 |
Dependent functional status | 2 vs 4 | .027 |
Urinary tract infection | ||
Female sex | 6 vs 8 | .009 |
Deep vein thrombosis | ||
Body mass index ≥30 kg/m2 | 5 vs 10 | .015 |
Death | ||
End-stage renal disease | 10 vs 11 | .031 |
aBaseline characteristics that were independently associated with the timing of each adverse event were identified through a backwards stepwise selection process initially including all characteristics listed in Table 1, and sequentially excluding characteristics with the weakest associations until only characteristics with P < .05 remained. Independent associations with the timing of cardiac arrest, stroke, urinary tract infection, deep vein thrombosis, and death are shown. There were no characteristics independently associated with timing of myocardial infarction, pneumonia, pulmonary embolism, sepsis, or surgical site infection; hence, these adverse events are not listed in the table.
bFrom final Cox proportional hazards models identified through multivariate stepwise selection.
Continue to: DISCUSSION...

