
Time-to-Surgery for Definitive Fixation of Hip Fractures: A Look at Outcomes Based Upon Delay


TAKE-HOME POINTS
- Time-to-surgery for definitive fixation of hip fractures is a modifiable risk factor.
- This study fails to demonstrate a benefit in delaying surgery for medical optimization as there were no time-to-surgery related differences in complications (P = 1.43).
- Delay in definitive surgery results in an increase in the total length of stay (P < .001) and surgery-to-discharge time (P < .001) without an improvement in overall complications, readmission or 30-day mortality rates.
- Despite numerous investigations, there are no consensus guidelines to decrease complications and mortality rates following hip fracture surgery.
- ACS-NSQIP database is a reliable and validated database.
RESULTS
A study population of 6036 hip fractures was identified and divided into 3 groups of 2012 subjects each based upon time-to-surgery. The groups were successfully matched for surgery type, age (≥75 years old), gender, and ASA class. In each group, 594 of the 2012 (29.5%) patients were male, 1525 (75.8%) were ≥75 years of age, 9 (.5%) were ASA Class I, 269 (13.4%) were ASA Class II, 1424 (70.8%) were ASA class III, and 309 (15.4%) were ASA class IV.
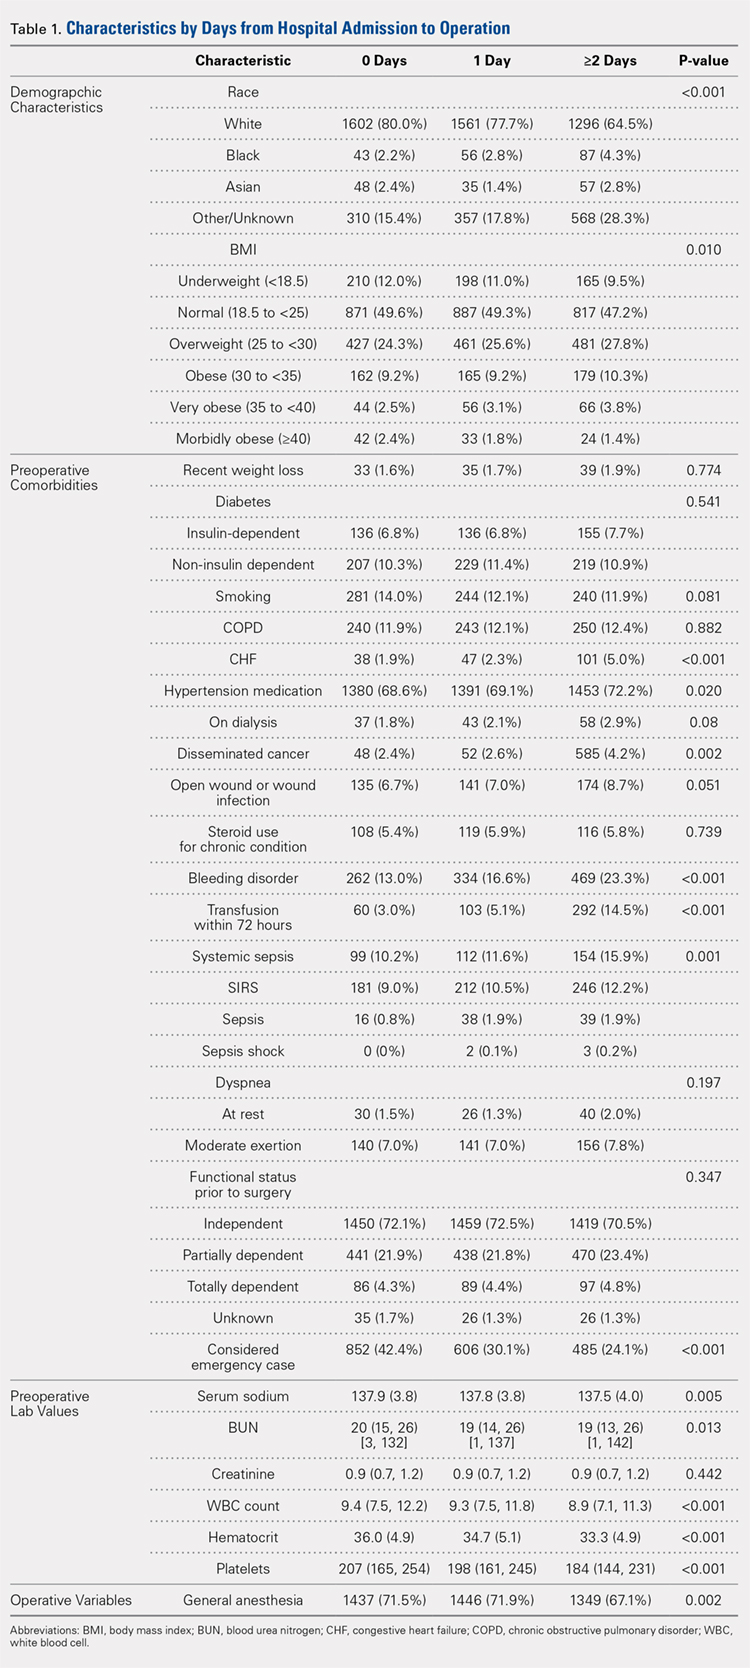
Significant differences in preoperative comorbidity burden and preoperative lab values were identified between the 3 cohorts. Increased time-to-surgery was associated with differences in race (P < .001), elevated BMI (P = .010), higher rates of congestive heart failure (P < .001), hypertension medication (P = .020), bleeding disorders (P < .001), blood transfusion within 72 hours of surgery (P < .001), and systemic sepsis (P = .001). Delay to surgery was also associated with lower preoperative sodium (P = .005), blood urea nitrogen (P = .013), serum WBC (P < .001), hematocrit (P < .001), and platelets (P < .001) (Table 1).
The unadjusted analyses revealed no association between time-to-surgery and return to OR (P = .554) nor readmission (P = .285). However, increasing time-to-surgery was associated with an increase in overall complications (P = .034), total length of hospital stay (P < .001), and 30-day mortality (P = .039) (Table 2).
Table 2. Estimated Event Rates from Matched Cohorts (Unadjusted)
Time From Presentation to Definitive Fixation | ||||
Outcomes | <24 hours | 24-48 hours | >48 hours | P-value |
Overall complication rate | 15.30% | 15.30% | 17.90% | 0.034 |
Total length of stay | 5.4 | 6.7 | 10.9 | <0.001 |
(mean days, 95% confidence interval) | (5.2, 5.7) | (6.5, 7.0) | (10.3, 11.5) | |
Time from OR to discharge | -ref- | 0.96 | 0.74 | <0.001 |
(Hazard ratio) | (0.90,1.02) | (0.69, 0.79) | ||
Return to OR | 2.40% | 2.40% | 2.00% | 0.554 |
Readmission | 9.60% | 8.40% | 8.30% | 0.285 |
30-day mortality rate | 5.80% | 5.30% | 7.20% | 0.039 |
Abbreviation: OR, operating room.
The adjusted analysis controlling for preoperative demographic and comorbidity variables revealed trends toward the increased overall complications and 30-day mortality with increased time-to-surgery; these trends showed no statistical significance (P = .143 and P = .08). No statistical relationship was observed between return to OR nor readmission and time-to-surgery. Increasing time-to-surgery remained significantly associated with the increased total length of hospital stay (P < .001). The adjusted analysis also revealed that the delay of >48 hours in time-to-surgery resulted in a longer surgery-to-discharge time (P < .001) (Table 3). No evidence of violation of the proportional hazards assumption was observed in the unadjusted nor adjusted clustered proportional hazards models (Wald test, P = .27 and P = .25, respectively).
Table 3. Estimated Event Rates from Matched Cohorts (Adjusteda)
Time from Presentation to Definitive Fixation | ||||
Outcomes | <24 hours | 24-48 hours | >48 hours | P-value |
Overall complication rate | 11.70% | 10.70% | 12.60% | 0.143 |
Total length of stay | 4.2 | 5.1 | 7.6 | <0.001 |
(mean days, 95% confidence interval) | (4.0, 4.5) | (4.8, 5.5) | (7.1, 8.3) | |
Time from OR to discharge | -ref- | 1.03 | 0.87 | <0.001 |
(Hazard ratio) | (0.97, 1.09) | (0.81, 0.92) | ||
Return to OR | 2.10% | 2.10% | 1.60% | 0.541 |
Readmission | 7.20% | 6.40% | 6.00% | 0.304 |
30-day mortality rate | 4.20% | 3.70% | 5.20% | 0.08 |
aModel adjusted for race, hypertension medication, cancer, bleeding disorders, transfusion within 72 hours before surgery, emergency status, wound infection, anesthesia type (general), body mass index (18.5-25), history of chronic obstructive pulmonary disease, and preoperative levels of creatinine, platelet count, white blood cell count, and hematocrit.
Continue to: DISCUSSION...

