
Starting insulin in type 2 diabetes: Continue oral hypoglycemic agents?


A randomized trial in primary care
Results
In total, 69 patients were randomized, 5 of whom did not initiate the intervention. Baseline characteristics of included patients are summarized in Table 1. Except for weight and body mass index, no significant differences were found between the groups.
TABLE 1
Characteristics at baseline (n=64)
| IC | IM | |
|---|---|---|
| Number of patients | 33 | 31 |
| Age, years | 58.6 (8.6) | 58.3 (11.3) |
| Sex, % male/female | 54 / 46 | 42 / 58 |
| Duration of diabetes, years | 7.2 (3.9) | 7.7 (4.8) |
| Body weight, kg | 96.3 (19.4) | 81.0 (14.3) |
| Body mass index, kg/m2 | 33.2 (6.4) | 28.5 (3.8)* |
| HbA1c,% | 8.3 (0.9) | 8.8 (1.5) |
| Satisfaction with treatment | 28.0 (8.2) | 26.1 (8.1) |
| General well-being | 21.7 (8.1) | 22.7 (6.9) |
| Results are means (SD), numbers, or percentages; * P<.01. IC, insulin combination therapy; IM, insulin monotherapy. | ||
Glycemic control and insulin dosage
In both groups, HbA1c improved, mainly during the first months (Figure 1). In the IC group, mean decrease was 0.8 ± 1.3%, vs 1.2 ± 1.2 in the IM group. Adjusted for baseline values, HbA1c for IM fell by 0.14% more than for IC (95% confidential interval [CI], –0.72 to 0.44; P=NS). In the IC group, 36% of the patients reached HbA1c levels <7.0%, compared with 42% in the IM group (P = NS).
When treatment failures (see below) were omitted, mean decrease of Hb A1c for IC was 1.0 ± 1.2% (Figure 2). Mean daily insulin dosages at endpoint were 25.8 ± 12.2 IU for IC vs 68.3 ± 27.5 for IM. Mean daily dosages adjusted for body weight were 0.27 ± 0.13 IU/kg for IC vs 0.86 ± 0.37 for IM.
FIGURE 1
Course of HbA1c values (SD)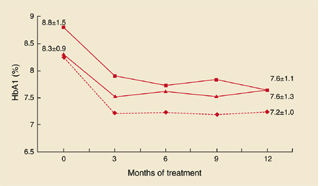
HbA1c values and standard deviations during the study. Squares: IM group; triangles: IC group; diamonds: IC group without treatment failures.
FIGURE 2
Combination vs monotherapy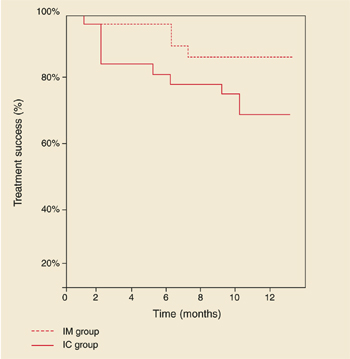
Kaplan-Meier curves showing treatment success of insulin combination therapy (IC) and insulin monotherapy (IM).
Treatment failures
In the IC group, 8 patients (24%) experienced a treatment failure because glucose targets were not reached with a daily dose of 40 IU NPH insulin. The mean time for reaching this study endpoint was 4.6 months (range, 1–10). HbA1c deteriorated in this period from 8.5 ± 1.3 % to 8.6 ± 1.5%.
Age, sex, duration of diabetes, and baseline values for HbA1c, body mass index, treatment satisfaction, and general well-being of these patients did not significantly differ from those who completed the study on IC therapy (data not shown). Mean daily insulin dosages at endpoint, adjusted for body weight, were 0.41 ± 0.13 IU/kg for treatment failures vs 0.23 ± 0.11 for non-treatment failures (95 % CI, 0.10 to 0.28; P<.001). In the IM group, 2 patients (6%) were switched to another insulin regimen due to unsatisfactory diurnal glucose profiles. Figure 2 shows the Kaplan-Meier curves of probability of treatment success. Log-rank test showed a borderline significant difference between the groups (P=.09).
Weight gain
In the IC group, body weight increased with 1.3 ± 3.9 kg, compared with 4.2 ± 4.3 kg in the IM group. Adjusted for baseline values, body weight in the IM group increased by 3.0 kg more than in the IC group (95% CI, 0.68 to 5.25; P=.01).
Hypoglycemic events and symptoms
The average number of hypoglycemic events per patient was 2.7 ± 5.2 in the IC group, and 4.3 ± 4.3 for the IM group (P=.02). For events accompanied by documented blood glucose values <4.0 mmol/L, the results were 2.4 ± 5.2 and 2.7 ± 3.5, respectively (P=.1). All events were mild, expect for 1 patient in the IM group who experienced 2 severe events (unconsciousness and support needed from a third party). At 3 and 12 months, hypoglycemic symptoms scores were 17.2 ± 13.3 and 16.3 ± 16.0 for IC, vs 19.1 ± 15.6 and 22.4 ± 15.7 for IM (P=NS).
Diabetes treatment satisfaction and general well-being
Satisfaction with treatment improved in the IC group from 28.0 ± 8.2 to 30.9 ± 5.1, and in the IM group from 26.1 ± 8.1 to 28.4 ± 7.4. Adjusted for baseline values, the difference between the mean change scores was not significant (95% CI, –5.0 to 1.0; P=NS). Well-being scores increased from 21.7 ± 8.1 to 25.1 ± 6.8 in the IC group, vs 22.7 ± 6.9 to 22.8 ± 7.6 in the IM group. Adjusted for baseline scores, wellbeing for IC improved by 3.0 points more than for IM (95 % CI, 0.02 to 5.8; P=.05).
Fear of self-injecting and self-testing
At 3 and 12 months, FSI scores were 0.6 ± 1.3 and 0.5 ± 1.1 in the IC group, vs 2.1 ± 4.1 and 1.0 ± 2.1 in the IM group. For FST, these scores were 0.6 ± 1.9 and 2.3 ± 4.8 in the IC group, and 2.5 ± 4.4 and 1.7 ± 3.6 in the IM group. At neither 3 nor 12 months were statistical differences found between the groups. Approximately 70% of the patients in both groups had scores of 0 (no fear at all) on both subscales.


