
Rheumatoid Arthritis vs Osteoarthritis: Comparison of Demographics and Trends of Joint Replacement Data from the Nationwide Inpatient Sample


TAKE-HOME POINTS
- Patients undergoing THA for OA, when compared to those with RA undergoing THA, had lower risk for postoperative cardiovascular, pulmonary, wound dehiscence, infections, and systemic complications.
- Patients with OA undergoing THA had statistically significant higher risk of cerebrovascular complication compared to RA patients undergoing the same procedure.
- In TKA, OA patients had significantly higher risk for cardiovascular and cerebrovascular complications, and a significant lower risk for mechanical wounds, infection, and systemic complications.
- RA patients are at higher risk for postoperative infection, wound dehiscence, and systemic complications after TKA and THA compared to OA patients.
- These findings highlight the importance of preoperative medical clearance and management to optimize RA patients and improve the postoperative outcomes.
Rheumatoid arthritis (RA) is a chronic systemic inflammatory disease that causes joint deterioration, leading to pain, disability, systemic complications, short lifespan, and decline in quality of life.1-3 The deterioration primarily affects the synovial membranes of joints, causing arthritis and resulting in extra-articular sequelae such as cardiovascular disease,4 pulmonary disease,5 and increased infection rates.3,6 RA is the most prevalent inflammatory arthritis worldwide and affects up to 50 cases per 100,000 in both the US and northern Europe.2,7-9 Although the gold standard of care for these patients is medical management with immunosuppressant drugs such as disease-modifying anti-rheumatic drugs (DMARDs), total joint arthroplasty (TJA) remains an important tool in the management of joint deterioration in such patients.
Total knee arthroplasty (TKA) and total hip arthroplasty (THA) are common procedures utilized to treat disorders that cause joint pain and hindered joint mobility, including osteoarthritis (OA) and RA. Given the aging population, the amount of TKAs and THAs performed in the US has consistently increased each year, with the vast majority of this increase composed of patients with OA.10 As a result, previous studies investigated the trends and outcomes of these procedures in patients with OA, but relatively less is known about the outcomes and trends of patients with RA undergoing the same surgeries.
Given that RA is a fundamentally different condition with its own pathological characteristics, an understanding of how these differences may impact postoperative outcomes in patients with RA is important. This study aims to present a comparative analysis of the trends and postoperative outcomes between patients with RA and OA undergoing TKA and THA (Figure 1, Tables 1 and 2).
,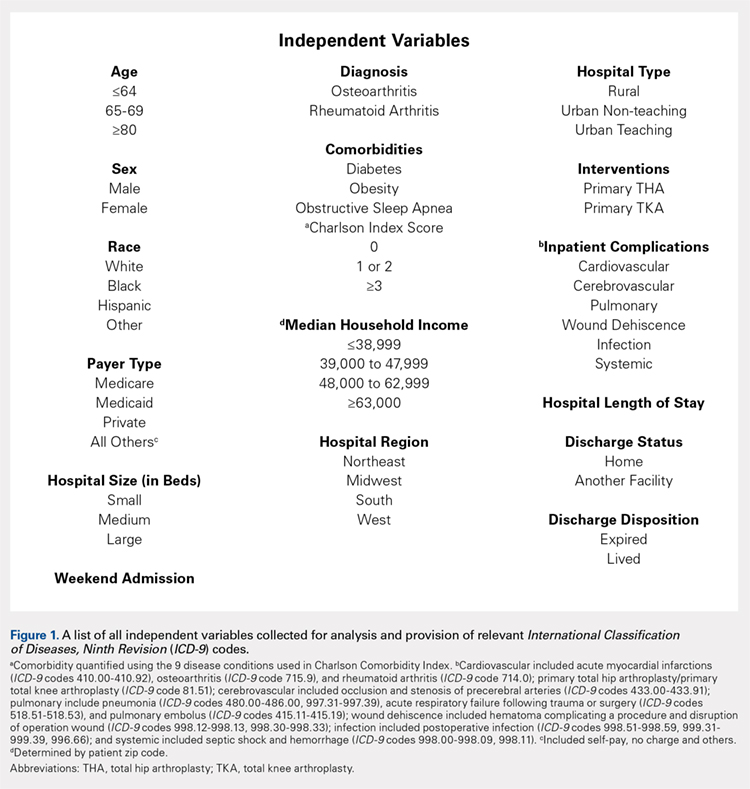
Table 1. Demographics of Total Knee Arthroplasty Patients Based on Primary Diagnosis of Osteoarthritis
OA | RA | Total | P Value | ||||
No. | Percent | No. | Percent | No. | Percent | (RA vs OA) | |
Age group | <.0001 | ||||||
<64 years | 295,637 | 42.42 | 11,325 | 48.90 | 306,962 | 42.63 | |
65 to 79 years | 329,034 | 47.22 | 10,055 | 43.42 | 339,089 | 47.09 | |
≥80 years | 72,197 | 10.36 | 1780 | 7.69 | 73,977 | 10.27 | |
Gender | <.0001 | ||||||
Male | 259,192 | 37.19 | 4887 | 21.12 | 264,079 | 36.68 | |
Female | 435,855 | 62.54 | 18,248 | 78.88 | 454,103 | 63.07 | |
Race | <.0001 | ||||||
White | 468,632 | 67.25 | 14,532 | 77.18 | 483,164 | 67.10 | |
Black | 39,691 | 5.7 | 2119 | 11.25 | 41,810 | 5.81 | |
Hispanic | 28,573 | 4.1 | 1395 | 7.41 | 29,968 | 4.16 | |
Other | 21,306 | 3.06 | 783 | 4.16 | 22,089 | 3.07 | |
Region of hospital | <.0001 | ||||||
Northeast | 112,031 | 16.08 | 3417 | 14.75 | 115,448 | 16.03 | |
Midwest | 192,595 | 27.64 | 5975 | 25.80 | 198,570 | 27.58 | |
South | 257,855 | 37 | 9422 | 40.68 | 267,277 | 37.12 | |
West | 134,387 | 19.28 | 4346 | 18.77 | 138,733 | 19.27 | |
Location/teaching status of hospital | <.0001 | ||||||
Rural | 86,321 | 12.39 | 2709 | 11.79 | 89,030 | 12.36 | |
Urban non-teaching | 333,043 | 47.79 | 10,905 | 47.46 | 343,948 | 47.77 | |
Urban teaching | 273,326 | 39.22 | 9363 | 40.75 | 282,689 | 39.26 | |
Hospital location | .0024 | ||||||
Rural | 86,321 | 12.39 | 2709 | 11.79 | 89,030 | 12.36 | |
Urban | 606,369 | 87.01 | 20,268 | 88.21 | 626,637 | 87.03 | |
Hospital teaching status | <.0001 | ||||||
Teaching | 409,465 | 58.76 | 13,275 | 57.78 | 422,740 | 58.71 | |
Non-teaching | 283,225 | 40.64 | 9702 | 42.22 | 292,927 | 40.68 | |
Comorbidities | |||||||
Obstructive sleep apnea | 65,342 | 9.38 | 1946 | 8.40 | 67,288 | 9.35 | <.0001 |
Diabetes | 147,292 | 21.14 | 4289 | 18.52 | 151,581 | 21.05 | <.0001 |
Obesity | 129,277 | 18.55 | 3730 | 16.11 | 133,007 | 18.47 | <.0001 |
Abbreviations: OA, osteoarthritis; RA, rheumatoid arthritis.
Table 2. Demographics of Total Hip Arthroplasty Patients Based on Primary Diagnosis of Osteoarthritis or Rheumatoid Arthritis
OA | RA | Total | P Value | ||||
No. | Percent | No. | Percent | No. | Percent | (RA vs OA) | |
Age group | <.0001 | ||||||
<64 years | 133,645 | 45.18 | 4679 | 48.02 | 138,324 | 45.27 | |
65 to 79 years | 123,628 | 41.8 | 3992 | 40.97 | 127,620 | 41.77 | |
≥80 years | 38,513 | 13.02 | 1073 | 11.01 | 39,586 | 12.96 | |
Gender | <.0001 | ||||||
Male | 129,708 | 43.85 | 2457 | 25.24 | 132,165 | 43.26 | |
Female | 165,010 | 55.79 | 7278 | 74.76 | 172,288 | 56.39 | |
Race | <.0001 | ||||||
White | 207,005 | 69.98 | 6322 | 80.08 | 213,327 | 69.82 | |
Black | 15,505 | 5.24 | 771 | 9.77 | 16,276 | 5.33 | |
Hispanic | 6784 | 2.29 | 522 | 6.61 | 7306 | 2.39 | |
Other | 7209 | 2.44 | 280 | 3.55 | 7489 | 2.45 | |
Region of hospital | <.0001 | ||||||
Northeast | 58,525 | 19.79 | 1683 | 17.27 | 60,208 | 19.71 | |
Midwest | 79,040 | 26.72 | 2446 | 25.10 | 81,486 | 26.67 | |
South | 95,337 | 32.23 | 3716 | 38.14 | 99,053 | 32.42 | |
West | 62,884 | 21.26 | 1899 | 19.49 | 64,783 | 21.20 | |
Location/teaching status of hospital | .0065 | ||||||
Rural | 30,954 | 10.46 | 993 | 10.26 | 31,947 | 10.46 | |
Urban non-teaching | 133,061 | 44.99 | 4245 | 43.87 | 137,306 | 44.94 | |
Urban teaching | 130,150 | 44 | 4439 | 45.87 | 134,589 | 44.05 | |
Hospital location | .4098 | ||||||
Rural | 30,954 | 10.46 | 993 | 10.26 | 31,947 | 10.46 | |
Urban | 263,211 | 88.99 | 8684 | 89.74 | 271,895 | 88.99 | |
Hospital teaching status | .0077 | ||||||
Teaching | 159,313 | 53.86 | 5108 | 52.78 | 164,421 | 53.82 | |
Non-teaching | 134,852 | 45.59 | 4569 | 47.22 | 139,421 | 45.63 | |
Comorbidities | |||||||
Obstructive sleep apnea | 19,760 | 6.68 | 573 | 5.88 | 20,333 | 6.65 | .0028 |
Diabetes | 41,929 | 14.18 | 1325 | 13.60 | 43,254 | 14.16 | .1077 |
Obesity | 38,808 | 13.12 | 1100 | 11.29 | 39,908 | 13.06 | <.0001 |
Abbreviations: OA, osteoarthritis; RA, rheumatoid arthritis
Continue to: Methods...


