
How Should the Treatment Costs of Distal Radius Fractures Be Measured?


Distal radius fractures (DRFs) are common, but the best way to measure the total cost of treating these injuries is not known. We conducted a study to measure the total treatment cost of DRFs to identify which items should be measured, and for how long, to capture all major cost-drivers. Eighty-two patients with DRFs were included in this prospective, observational study. All costs, both direct and indirect, were measured. Direct costs were measured for each patient from internal billing records. Indirect costs were obtained with a customized questionnaire. The major contributors to overall cost were physician fees, operating room costs, occupational therapy, and missed work, which together accounted for 92% of total cost. Recurring indirect costs largely resolved within 3 months for nonoperative management and within 6 months for operative management. Physician fees, operating room costs, occupational therapy, and missed work are the major cost-drivers for DRFs and should be measured for at least 6 months after injury. Indirect costs, particularly those associated with missed work, represent a significant amount of the total overall cost.
Direct Costs
Direct costs were obtained from hospital billing and collections records. Cost items measured included physician fees, imaging fees, inpatient bed fees (when applicable), operating room (OR) facility fees, implant costs, and OT costs. Whenever possible, the final amount collected (vs charged) was used for the cost, as this was thought to be the most reliable indicator of the real cost of an item. Total cost was obtained from ultimate collection/reimbursement for all physician, imaging, and OT fees.
In a few cases, ultimate amount collected was not in our system and instead was calculated by normalizing the charges based on internal departmental cost-to-charge ratios. Cost-to-charge ratios were used for OR/emergency department facility fees, inpatient bed fees, and implant costs.
Indirect Costs
Indirect costs were calculated from questionnaires completed by patients at initial enrollment and at each follow-up visit. The initial enrollment form captured basic demographic information, employment status and work type, and annual income. The follow-up form included questions about current work status, physical/occupational therapy frequency, and extra recurring expenses related to transportation, household chores, and personal care, among other items. Total recurring expenses from transportation, chores, and personal care were calculated by multiplying the weekly expenses listed at a given visit by the time since the previous visit.
Costs for missed work were estimated as a function of preinjury wages multiplied by decreased level of productivity and period of work missed. For a patient who indicated part-time work status, decreased level of productivity was calculated by dividing the patient’s weekly hours by 40 (assumes 40-hour week is full-time), which yielded a percentage of full-time capacity. The patient was also asked to indicate any change in work status, which allowed for an accurate accounting of how long the patient was away from work and how much the patient’s capacity was decreased, ultimately providing an estimate of total amount of work missed. Multiplying that period by annual preinjury wages gave the value used for total cost of missed work.
Results
Of the 82 patients enrolled in the study, 36 were treated operatively and 46 nonoperatively. Table 1 lists additional demographic information about the study population. 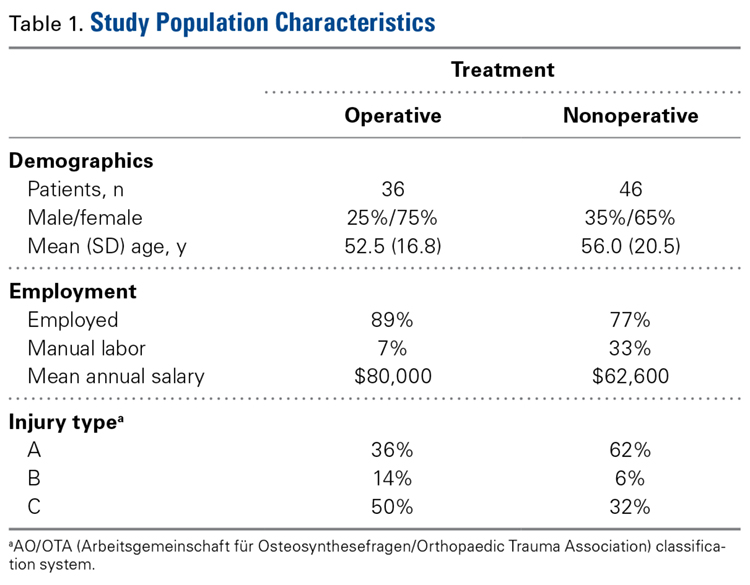
Table 2 provides a full breakdown of costs. OT costs were similar between groups but proportionally made up 27% of the costs for the nonoperative group and 4.9% for the operative group. 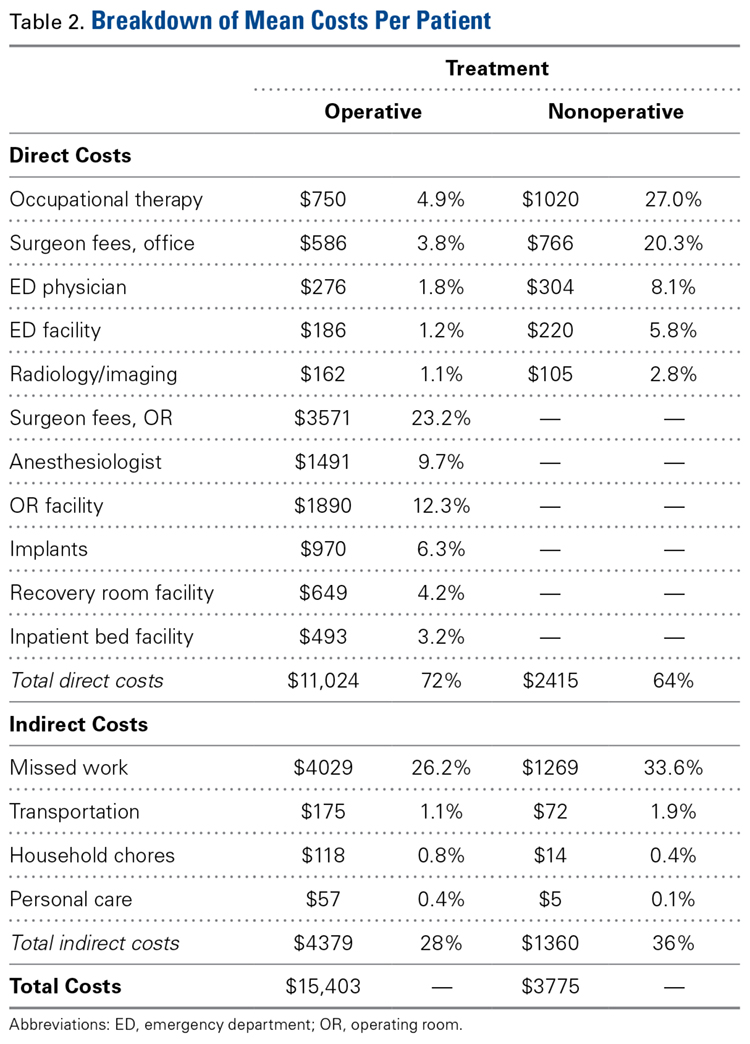
Indirect costs accounted for 28% of the total cost for the operative group and 36% for the nonoperative group. Missed work was the major contributor to overall indirect cost, accounting for 93% of all indirect costs. Additional transportation, household chores, and personal care costs accounted for 4.7%, 1.7%, and 0.8% of total indirect costs, respectively.
Of the nonoperatively treated patients who had been working before being injured, 25% missed at least some work. Except for 1 patient, all were back working full-time within 3 months after injury. Of the operatively treated patients who had been working before injury, 48% missed at least some work, and 24% were still missing at least some work between 3 and 6 months after injury. All patients in both groups were back working within 1 year after injury.
Indirect costs largely paralleled work status, with 50% of patients still incurring some costs up to 6 months after injury (Figure). 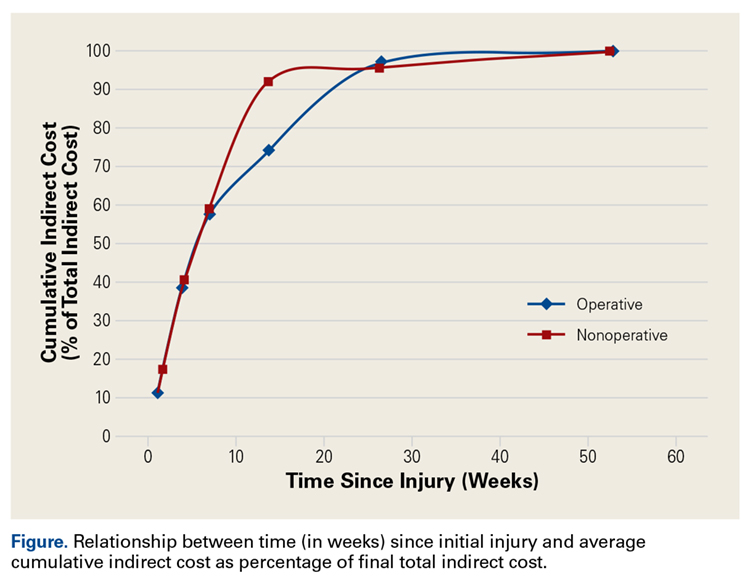
Discussion
The drive to use evidence-based treatments in medicine has led to increased scrutiny of the benefits of novel treatments and technologies. However, in addition to carefully measuring clinical benefits, we must monitor costs. Implementation of new treatments based on small clinical advantages, without consideration of economic impact, will not be sustainable over the long term.
This study was not intended to report the “true” cost of treating these injuries, or to make direct comparisons between operative and nonoperative groups (regional and institutional costs and practices vary so much that no single-site study can report a meaningful number for cost). Furthermore, the observational (nonrandomized) nature of this study makes direct comparison of operative and nonoperative groups too confounded to draw conclusions. Simply, this study was conducted to help determine what needs to be measured, with the ultimate goal being to obtain a relatively reliable estimate of the total cost to society of a given injury and its treatment.
In this study, physician fees and facility fees were major direct expenses—not surprising given the value of physician time and OR time. In addition, OT was a fairly large direct-cost driver, particularly for nonoperative patients, for whom other costs were relatively low. This finding supports what has been reported in studies of the frequency and duration of therapy as potential targets for cost containment.24 Surprisingly, OT costs were lower for operatively (vs nonoperatively) treated patients. This finding may be attributable to earlier wrist motion in operatively treated patients (10-14 days) relative to nonoperatively treated patients (6-8 weeks), as earlier wrist motion may reduce stiffness and total need for therapy. Alternatively, the finding may be attributable to sampling error caused by difficulty in obtaining accurate OT costs, as some patients received therapy at multiple private offices, with records unavailable.
Although significant attention is often focused on implant costs, these actually comprised a relatively small portion (6%) of the total treatment costs for these injuries. However, implant costs vary significantly between institutions.
Indirect costs were a major factor, accounting for about one-third of total cost. Missed work was the single largest cost item in this study, comprising 93% of the indirect cost and 27% of the total cost. These findings suggest that the cost of missed work is crucial and should be measured in any study that compares the cost-effectiveness of different treatment modalities.
In orthopedic trauma, earlier return to work is often cited as a potential benefit of surgical intervention. However, without defining the exact economic impact of missed work, it is difficult to decide if earlier return to work justifies the added cost of surgery. The situation is further muddled by conflicting priorities, as the entities that bear the cost of missed work (patient, disability insurance) are often different from the entity that bears the cost of surgery (medical insurance). In the light of this complex decision-making with multiple and sometimes conflicting stakeholders, accurate understanding of the economic impact of missed work is paramount. Our data showed return to work took slightly longer for operatively (vs nonoperatively) treated patients, though we think this is more likely a result of higher injury severity than treatment choice.
Patients in both groups were still not back working up to 6 months after injury, indicating that return of function after these injuries is not as rapid as we might hope or expect, and may play a role in setting expectations during initial discussions with patients.
The major strength of this study is that it was the first of its kind to prospectively measure these costs at a single institution in order to make direct comparisons of different cost factors. Whenever possible, rather than relying on cost-to-charge ratio estimates, we analyzed costs obtained directly from collections reports, which improved the validity of the results generated. Missed work was captured by directly asking patients about work capacity, not by retrospectively reviewing disability applications, which for a variety of reasons often inaccurately reflects true work productivity. In addition, our final follow-up rate was relatively high (91%), which helped minimize bias. Although this study focused on DRFs, the hope is that these data can serve as a template for the kinds of factors that need to be measured to accurately describe the cost of many different upper extremity injuries. This idea, however, needs to be formally tested.
This study had several limitations. First, some costs (OR time, facility fees) still had to be estimated with cost-to-charge ratios—a less precise method. Second, measuring the societal cost of missed work is controversial. We calculated this cost by using standard economic techniques, valuing the decreased productivity period according to baseline salary, though the true “loss” to society is less clear. Third, our data represent the costs at one hospital in one city and might be very different at other institutions with different cost structures. Fourth, this study was observational (vs randomized) and subject to the usual bias of such studies, so conclusions between treatment choices and cost or clinical outcomes could not be drawn (which was not our intent in this study). Although these issues limited our ability to calculate the exact “cost” of these injuries, the relative impact of the different cost factors could be measured (which was our intent).
DRFs are common injuries that can have significant associated expenses, many of which were not captured in previous cost analyses. In the present study, we found that measuring physician, OR, therapy, and missed work costs for at least 6 months after injury was generally sufficient for accurate capture of major costs. We hope these data can help in planning studies of the treatment costs of upper extremity injuries. Only through accurate and conscientious data gathering can we evaluate the clinical and economic effects of novel technologies and ensure delivery of high-quality care while containing costs and improving efficiency.
Am J Orthop. 2017;46(1):E54-E59. Copyright Frontline Medical Communications Inc. 2017. All rights reserved.


