
As Hospitalists Cement their Worth, Compensation Continues Upward Climb


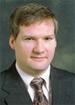
Dr. Landis, medical director of Wellspan Hospitalists in York, Pa., believes it is counter-productive to push wRVUs too high. He believes a hospitalist’s role is to provide patient care, lead process improvement, and coordinate multi-disciplinary teams. Too much of a focus on any one role takes away from physician efficacy.
“The value of a hospitalist goes well beyond the wRVU number,” he explains. “That being said, we are still in the business of seeing patients. I don’t think having a hospitalist that’s generating 1,500 RVUs and paying them at the 75th percentile is going to be very effective. You’re going to need to balance those out.”
continued below...
Apples to Apples?

Any researcher worth his academic salt will say that results are only as good as their N. And so hospitalists eager to glean data points from the MGMA’s Physician Compensation and Production Survey: 2012 Report Based on 2011 Data and SHM’s State of Hospital Medicine report need to remember that the numbers aren’t coming from the same source.
MGMA compiled compensation data on 3,402 full-time hospitalists nationwide. Slightly more than 56% of the respondents worked in hospital-owned practices, while 26% are in physician-owned groups. The rest reported “other” practice models.
SHM received submissions from 396 groups that serve adults only. Some 49% were hospital/IDS employed, 33% management companies, and the rest were academic or other models.
And while the MGMA survey data will be incorporated into SHM’s report, the information was culled from different universes. SHM encouraged its members to participate in the MGMA survey, but did not get involved beyond that. This is a change to the 2011 report, when the two groups jointly gathered data. And it is a change again from previous years, when SHM did its work separately, with little teamwork with MGMA.
While the changing methodologies can make year-to-year comparisons less precise or more difficult to craft, Dr. Landis says surveys need to evolve to ensure they’re asking the best questions and the questions users want answer to. Even then, though, he cautions ever reading too much into survey data.
“We’ve used the best tools to give good statistics, but in the end it’s not a scientific, placebo-controlled, double-blinded trial,” Dr. Landis says. “It’s a survey, and you need to keep in mind that’s what it is.”
—Richard Quinn
How Much Turnover Is Too Much Turnover?
Some HM leaders were pleased last year when hospitalist turnover dropped to 8% from a 14% turnover rate the year prior. This year’s State of Hospital Medicine report pegs the turnover figure at 10%. Although just a slight increase this year, Fuller views the uptick in turnover as a burgeoning cycle. While the supply-demand curve continues to push compensation up, increased turnover will continue to impact both sides of the equation.
“I’m sure there are many fully staffed programs, but they’re dealing with turnover,” he says. “They’re dealing with attrition, physicians leaving to go to fellowships, physicians relocating...physicians wanting to retire. I think it’s a crisis, a tremendous crisis that we need to be prepared to deal with for the near future.”
Aside from turnover data, the SOHM report this year looked to break new ground by trying out new questions. The report for the first time surveyed how hospitalists perform comanagement duties. In surgical comanagement cases, the hospitalist served as the admitting or attending physician 57% of the time. The rest of the time they served as a consultant. In medical comanagement, hospitalists were the admitting/attending physician 85% of the time (see “Comanagement Roles,”).
As hospitalists find specialties even within the field, the report also looked to put data to the cohort of nocturnists. Roughly half of those covering night shifts work fewer shifts than their daytime colleagues. Moreover, 63% of nocturnists earned a differential for that work (see Figure 4).

