Effects of Tranexamic Acid Cytotoxicity on In Vitro Chondrocytes


Use of topical tranexamic acid (TXA) in orthopedic surgery has been expanding over the past decade, with increasing evidence confirming reductions in perioperative blood loss and transfusion requirements, but there is minimal evidence regarding effects of TXA on native cartilage.
We conducted a study to understand the in vitro effects of TXA on bovine cartilage and murine chondrocytes and ultimately to expand the clinical application of topical TXA to include scenarios with retained native cartilage, such as hemiarthroplasty. Bovine cartilage explants were exposed to TXA at a concentration of 100 mg/mL, and glycosaminoglycan (GAG) release and cell viability were measured at 8, 24, and 48 hours. Monolayer murine chondrocytes were exposed to TXA 25, 50, and 100 mg/mL, and viability was measured at 8, 24, and 48 hours.
GAG released from bovine explants was significantly higher in the samples exposed to TXA 100 mg/mL at all time points. Cell viability was significantly decreased in the explants exposed to TXA 24 and 48 hours after initial incubation. Bovine chondrocyte viability was not affected by TXA 25 mg/mL. Murine chondrocyte viability was similar between the TXA 25 mg/mL and control samples at all time points. The TXA 50 mg/mL sample dropped from 66.51% viability at 8 hours to 6.81% viability at 24 hours and complete cell death by 48 hours. The TXA 100 mg/mL samples had no observable viable cells at 8, 24, and 48 hours.
Our data indicated that TXA 100 mg/mL damaged and was cytotoxic to bovine explanted cartilage and was cytotoxic to murine chondrocytes. Murine and bovine chondrocyte viability were not affected by TXA 25 mg/mL.
Explants were washed once in 75% ethanol and then digested in 0.5 mL papain digestion buffer (100 mM sodium phosphate, 10 mM EDTA, 10 mM L-cysteine, 0.125 mg/mL papain; Sigma-Aldrich) at 60°C for 24 hours. Digested samples were then diluted and subjected to GAG analysis.
Murine chondrocytes were harvested from the freshly harvested rib cages and sternums of mice (1-4 days old) as previously described.21 In brief, rib cages were washed twice in D-PBS and then incubated at 37°C for 60 min in 5 mL of 0.25% Trypsin-EDTA (Life Technologies). They were then washed in DMEM with 10% FBS, centrifuged at 1500 rpm for 5 min to remove the supernatant, and washed in sterile PBS. After removal of the PBS wash, the ribs were incubated in 2 mg/mL hyaluronidase in plain DMEM on a shaker at 37°C for 2 hours. Once soft tissue was removed, the rib cages were discarded, and the remaining soft tissue was incubated in a collagenase D/hyaluronidase digestion solution (collagenase D, 1 mg/mL; hyaluronidase, 1 mg/mL; BSA, 40 mg/mL in plain DMEM; Life Technologies) for 8 hours. The resultant cell suspension was filtered through a 40-µm cell strainer (BD Falcon). Isolated chondrocytes were then plated on culture slides (0.5×x106 cells; BD Falcon) and incubated in DMEM/F12 (1:1) complete media at 37°C and 5% CO2. Before experimental treatment, all cultures were visualized under phase microscopy to verify viability and morphology.
Murine chondrocytes were incubated in media (described above) containing TXA 0, 25, 50, or 100 mg/mL and were harvested 8, 24, or 48 hours after initial exposure. Cultures were maintained at 37°C and 5% CO2 until harvest. Culture medium was aspirated, and each sample was washed twice in sterile PBS before analysis with the LIVE/DEAD assay.
The amount of GAG released into the culture media was measured with a 1,9-dimethyl-methylene blue colorimetric assay (DMMB; 38.5 µM 1,9-dimethylmethylene blue, 40 mM glycine, 40.5 mM sodium chloride, 9.5 mM hydrochloric acid; Sigma-Aldrich) based on the method of Farndale and colleagues.22 In brief, 20 µL of media was mixed with the DMMB assay solution in a 96-well plate, and absorbance was read immediately at 530 nm on a microplate reader. Chondroitin 4-sulfate was used to produce a standard curve. Total GAG released into the media was then calculated based on the standard curve and calculated as a percentage of the total GAG content of each explant. Each sample time point and concentration had a replicate of 3.
Chondrocyte viability was assessed with use of the LIVE/DEAD Viability/Cytotoxicity Kit (Life Technologies) following the protocol. Cartilage explants were sectioned orthogonally to the articular surface at 100 µm per section. Four sections were obtained from each explant. Sections were then incubated in 60 µL of 1-µM calcein AM/1-µM ethidium homodimer-1 solution at room temperature in the dark for 30 minutes. Sections were then viewed with a fluorescent microscope, and 3 digital photographs (magnification ×4) were taken per sample with use of a fluorescein filter and a Texas red filter. The live and dead cells in an area were quantified with use of ImageJ, freely available image analysis software.23 This software was verified initially by blinded, manual count for accuracy. Each sample time point and concentration had a replicate of 3 or 4 explants.
Chondrocyte viability was assessed with the LIVE/DEAD Viability/Cytotoxicity Kit following the protocol. Slides were incubated in 200 µL of 1-µM calcein AM/1-µM ethidium homodimer-1 solution at 37°C in the dark for 30 minutes. Sections were then viewed with a fluorescent microscope, and 4 digital photographs (magnification ×4) were taken with use of a fluorescein filter and a Texas red filter. Live and dead cells in an area were quantified with use of ImageJ. Each sample time point and concentration had a replicate of 4 plates.
Statistical analyses were performed in the statistical environment R.24 Data were analyzed with a 2-tailed Student t test with Holm-Bonferroni correction made for multiple comparisons, and a family-wise error rate was set at α = 0.05.
Results
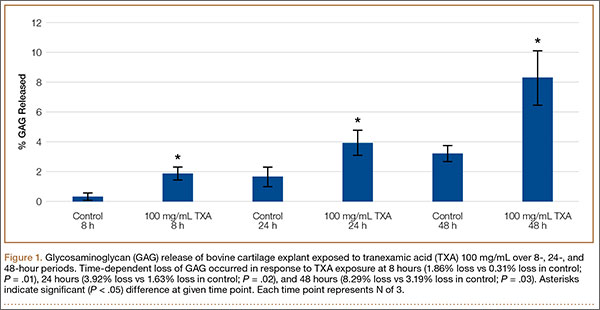
GAG release was notably higher in the explants exposed to TXA 100 mg/mL at all time points (Figure 1). Beginning 8 hours after initial incubation, there was a small but significant (P = .01) loss of GAG in TXA-treated explants (mean, 1.86%; SD, 0.44%) versus control explants (mean, 0.31%; SD, 0.24%). There was a trend of increasing loss with increasing time after initial incubation through 24 hours, GAG (mean, 3.92%; SD, 0.83%) versus control (mean, 1.63%; SD, 0.65%) (P = .02), reaching a peak at 48 hours, GAG (mean, 8.29%; SD, 1.82%) versus control (mean, 3.19%; SD, 0.53%) (P = .03).